| Metric | Value |
|---|---|
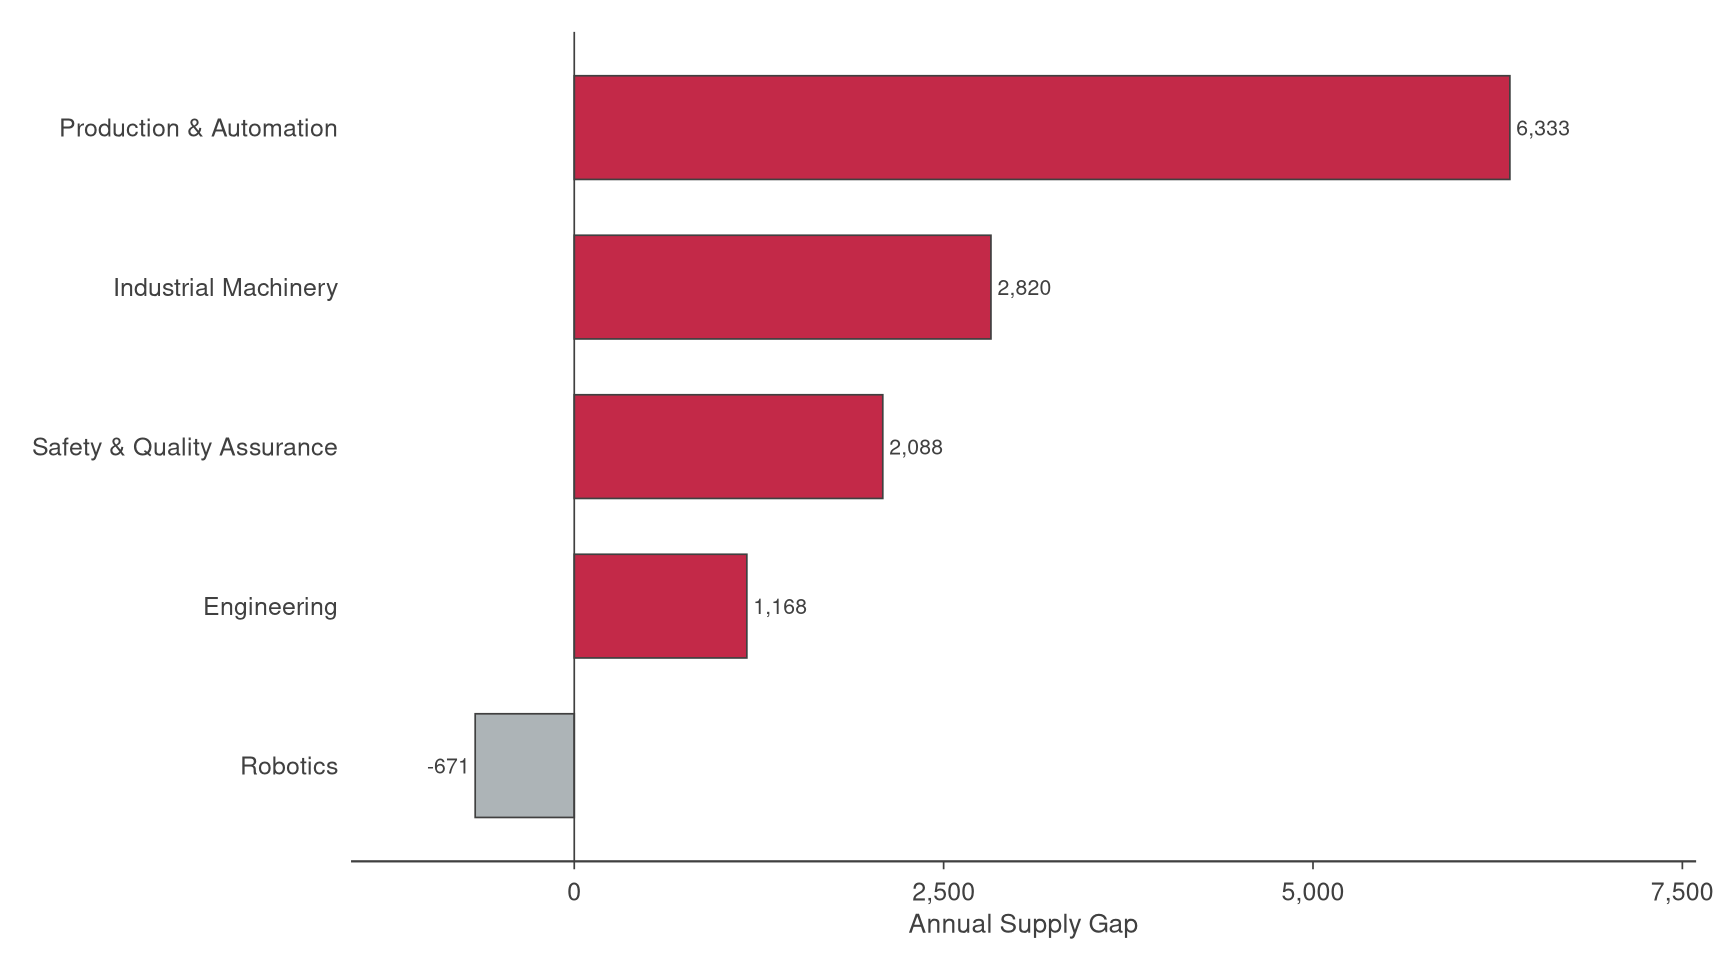
| Sub-Clusters | Engineering; Industrial Machinery; Production & Automation; Robotics; Safety & Quality Assurance |
| Adj. Graduates | 6,701 |
| Conversion Rate | 14.8% |
| Annual Supply Gap | 6,882 |
| Proj. Annual Growth | 483 |
| Total Employment | 381,782 |
| Total Earnings | $26.3B |
| Avg Earnings/Worker | $68,800 |
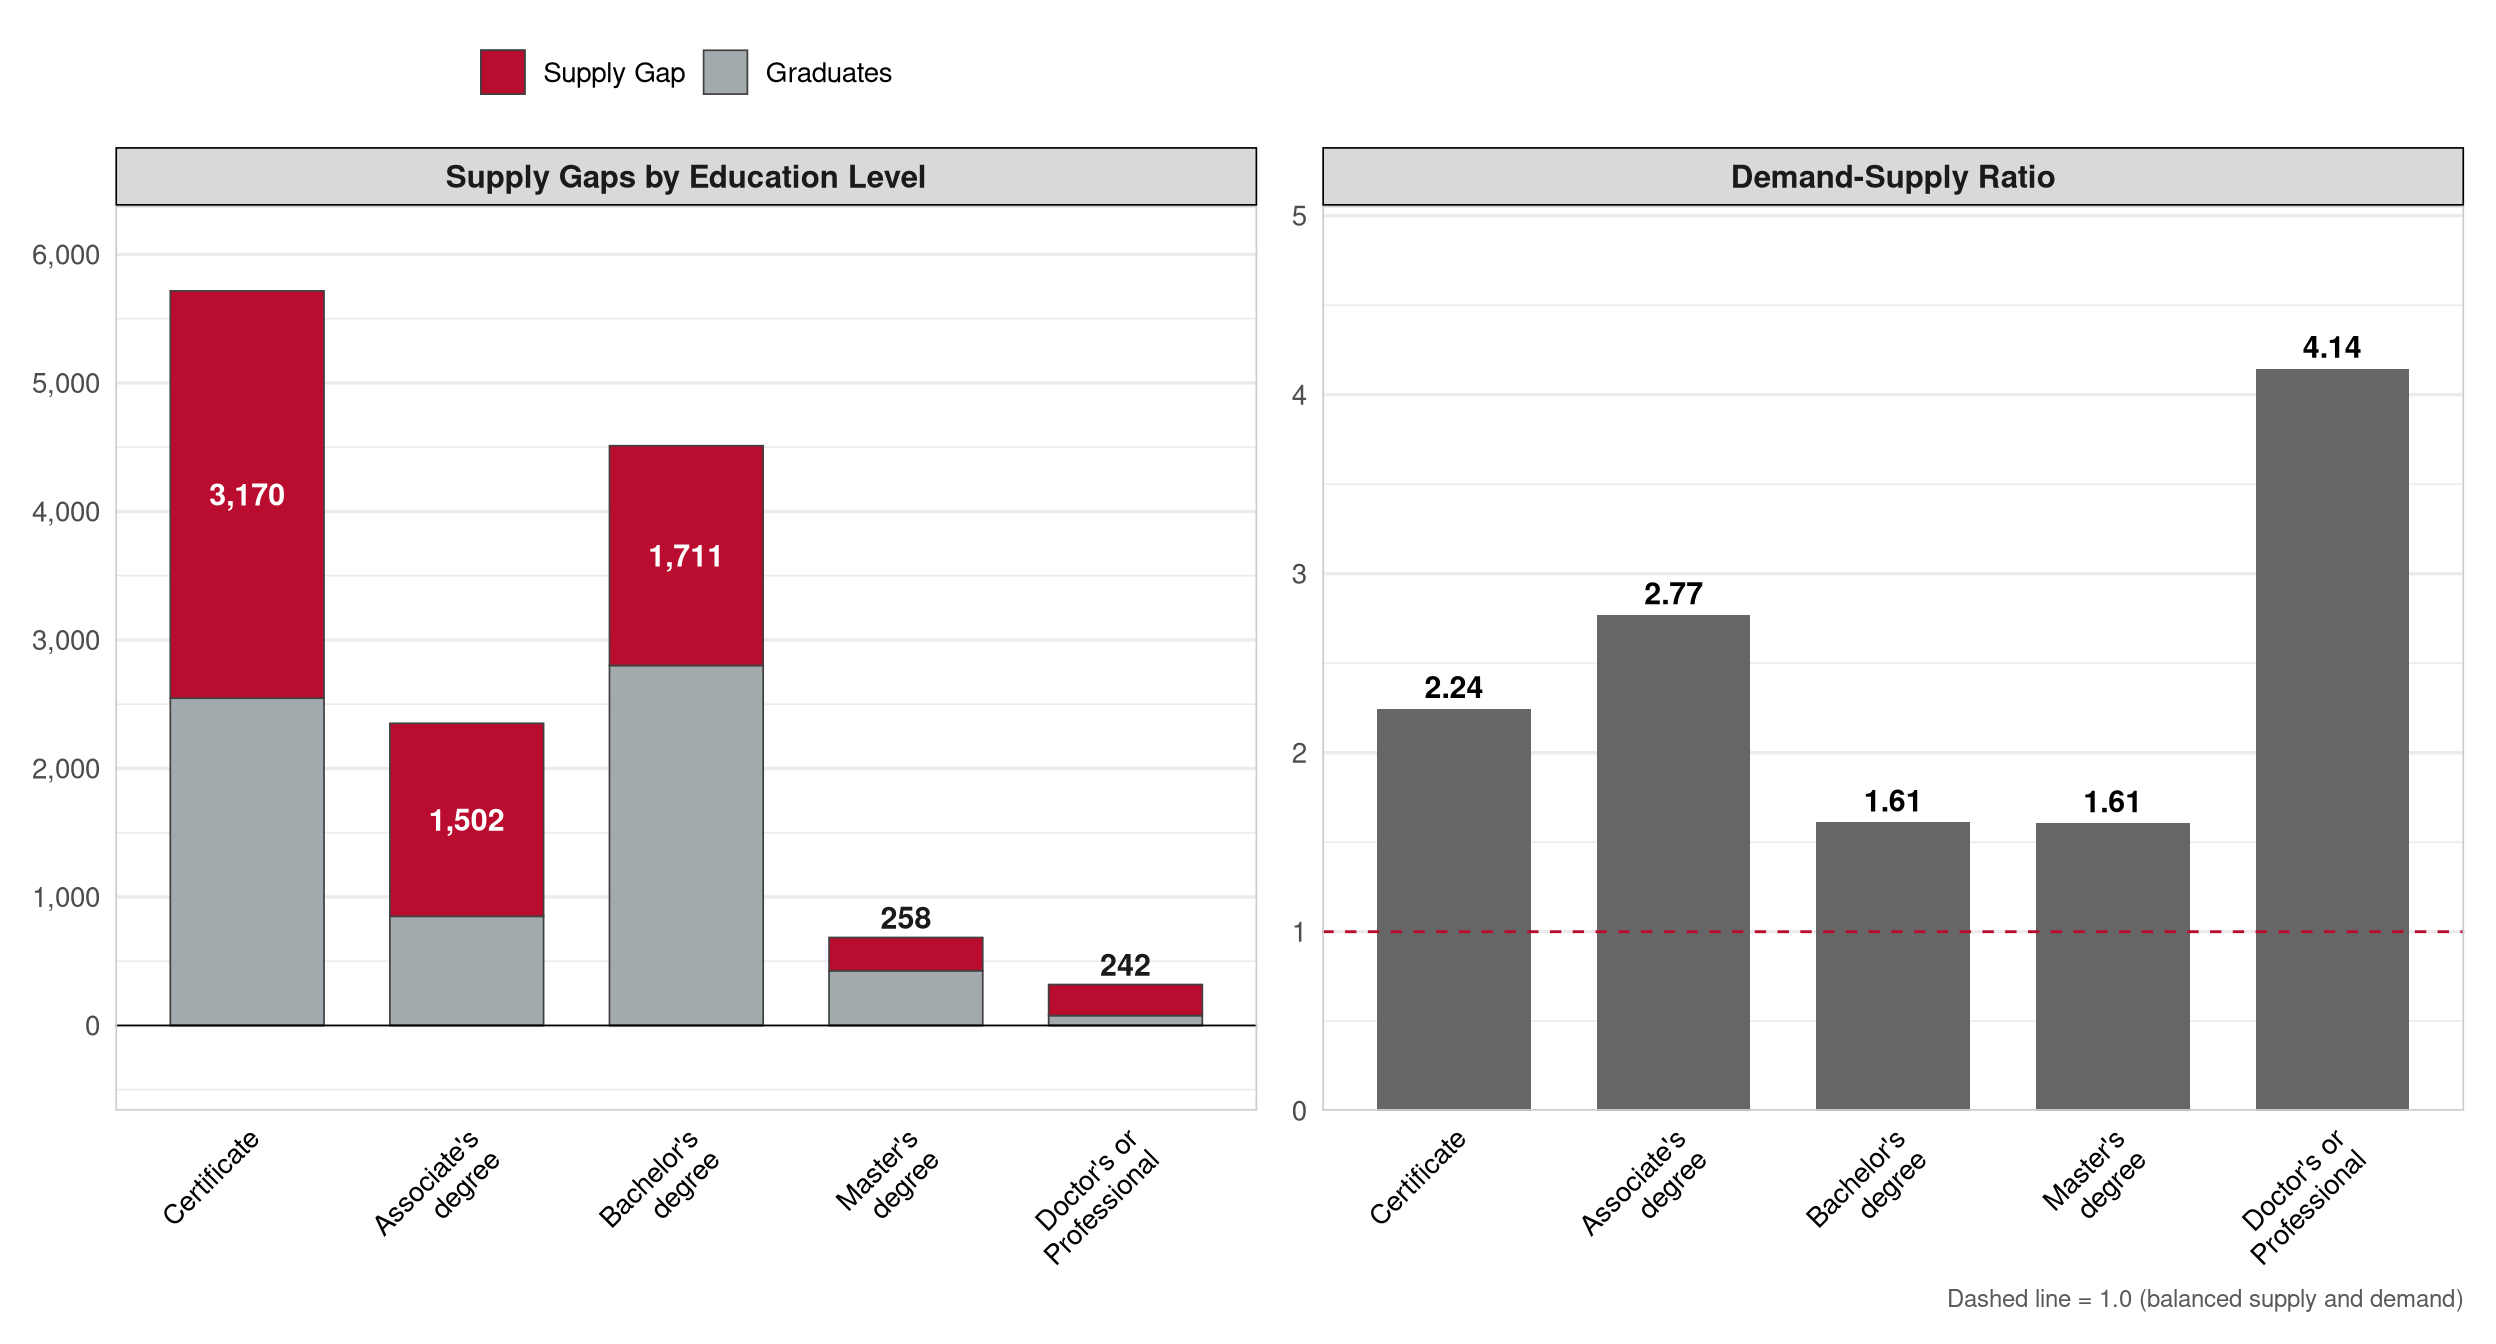
| D-S Ratio | 2.03 |
Career Cluster Analysis
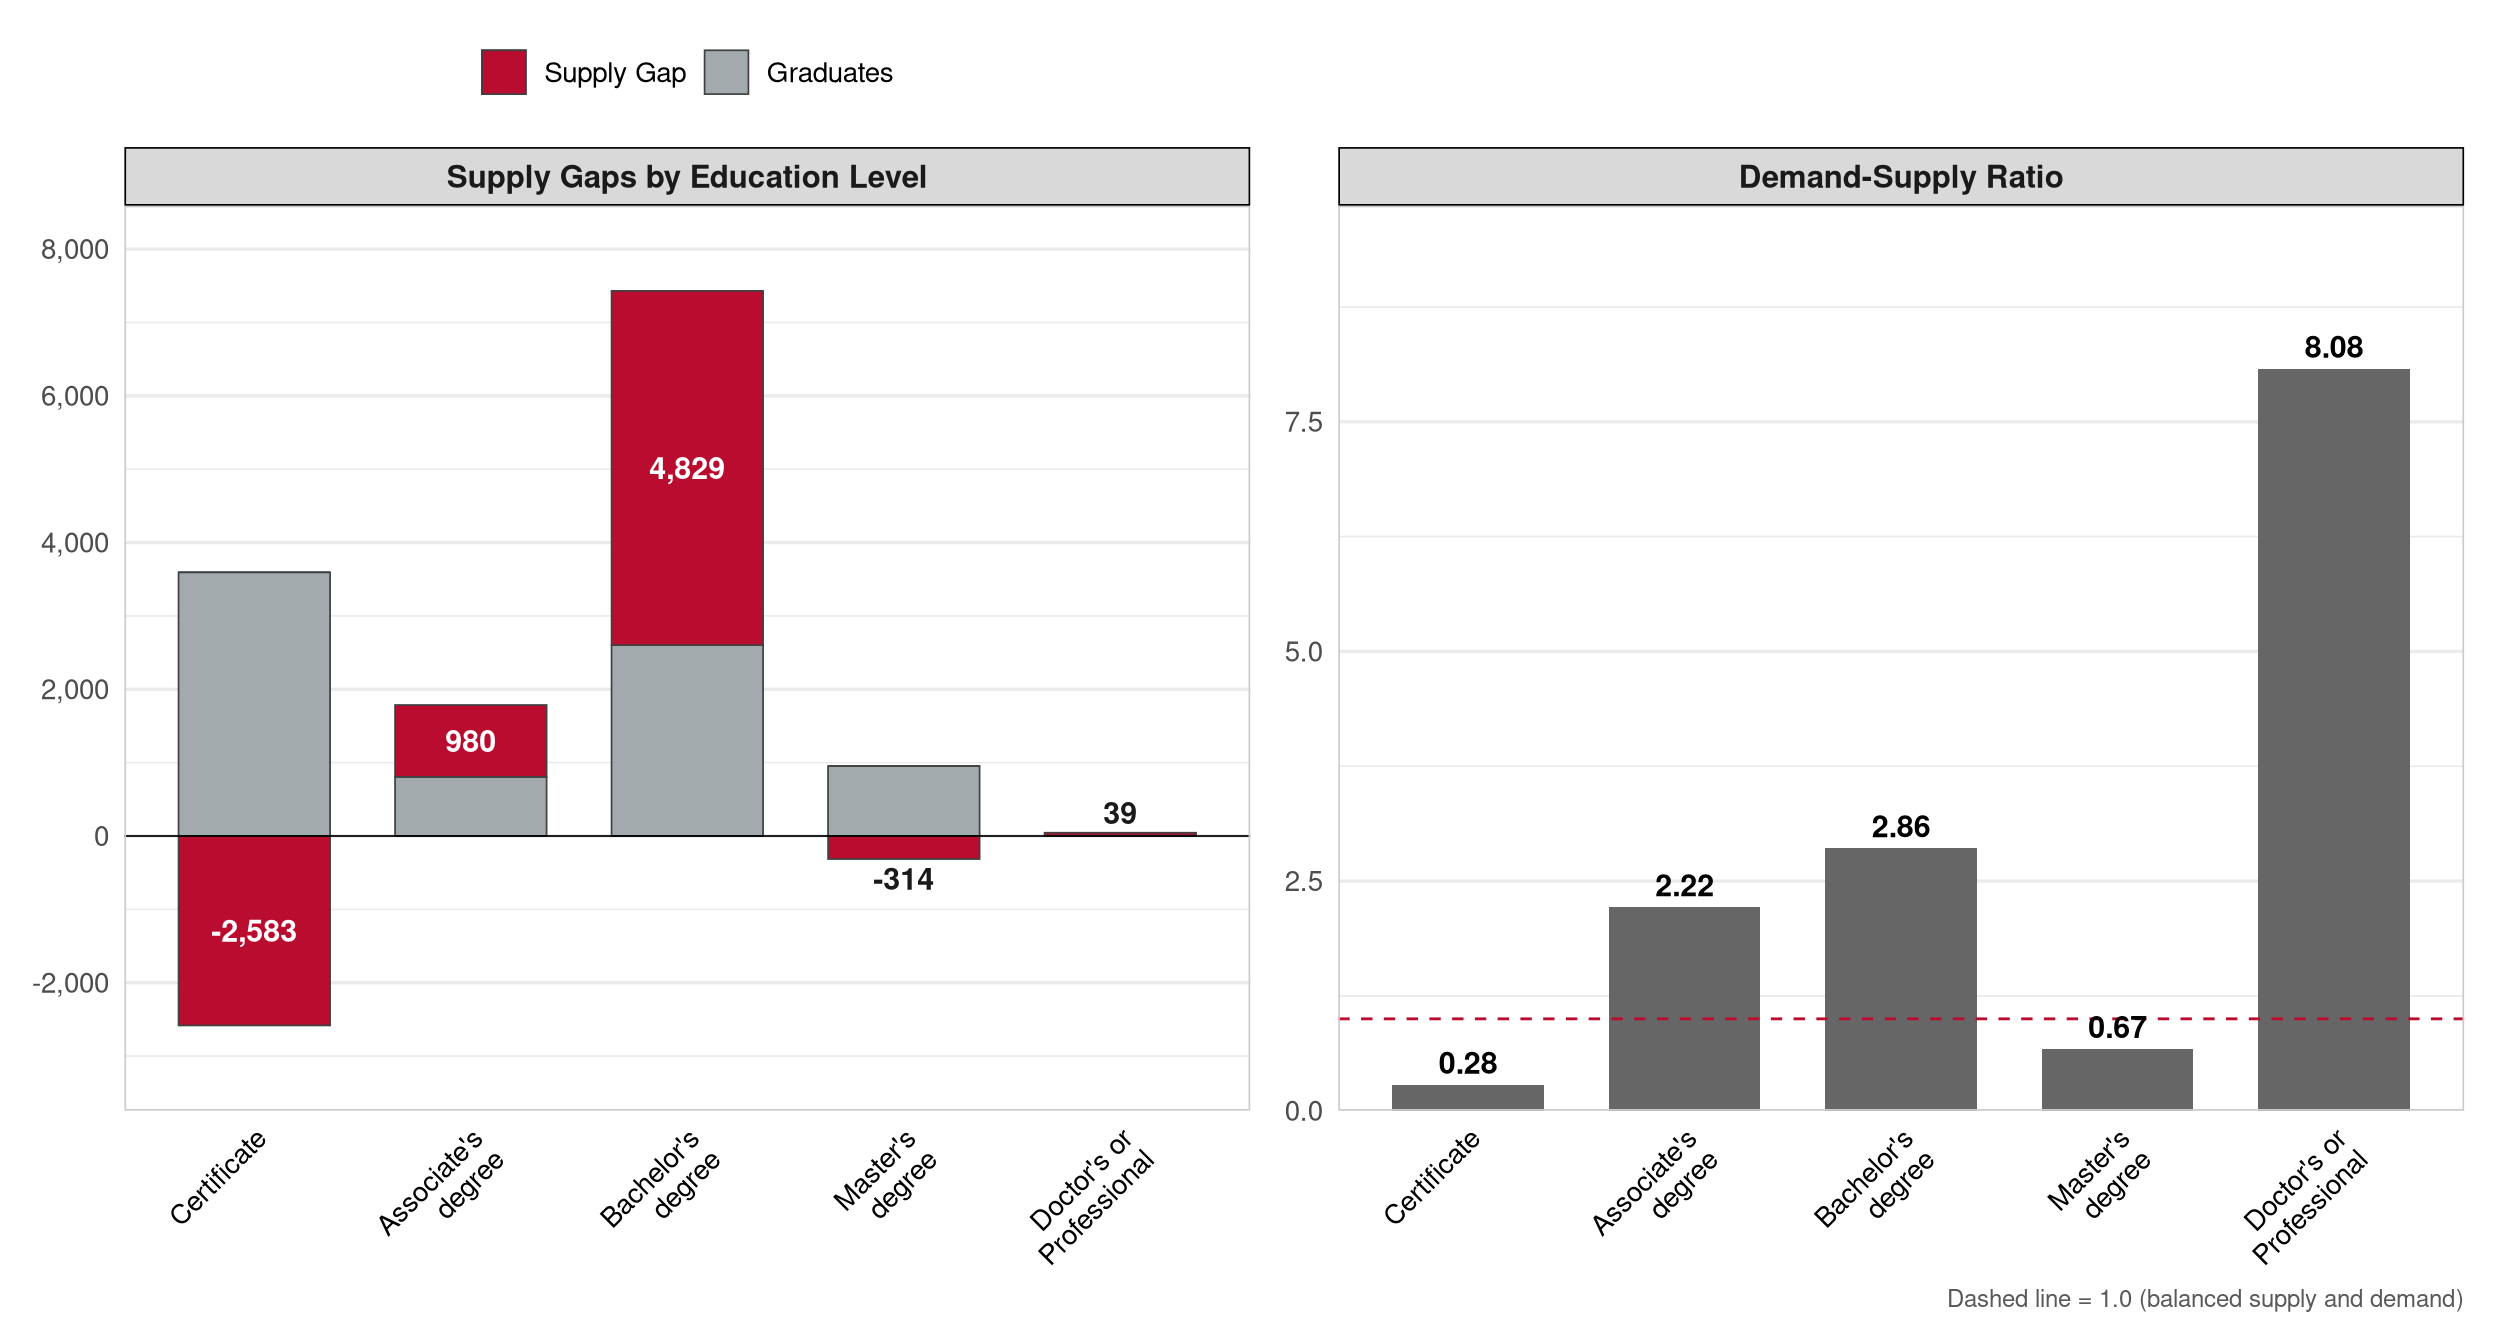
This section presents supply-demand conditions for each of Ohio’s 14 Career Clusters. Each cluster follows a standardized format: a snapshot table of key workforce and education metrics, a combined Sub-Cluster gap and institution type exhibit, a supply gap and demand-supply ratio exhibit by education level, and tables of top-producing institutions and programs. Sub-cluster names reflect the Advance CTE framework as implemented in the Ohio LMI crosswalk. Because occupations can map to multiple Sub-Clusters and Career Clusters are not mutually exclusive, gap figures within and across clusters should be interpreted as directional indicators of relative workforce pressure rather than additive totals.
Advanced Manufacturing
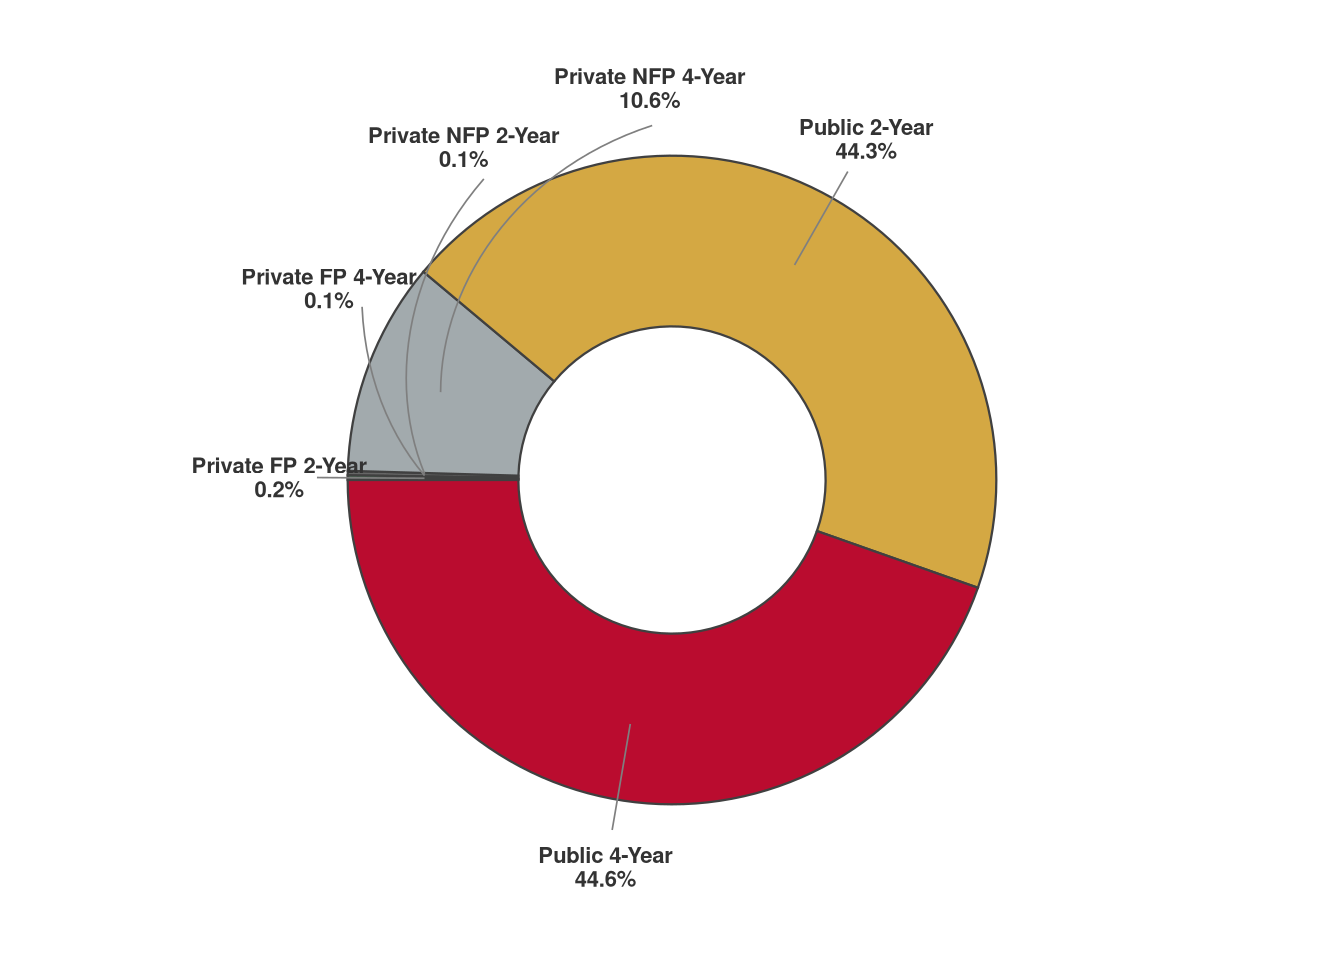
Advanced Manufacturing encompasses Ohio’s industrial production base, spanning precision engineering and robotics, quality assurance, industrial maintenance, and welding and fabrication. Ohio is among the top manufacturing states nationally; the cluster generates sustained demand across both sub-baccalaureate and bachelor’s-level pathways, with the bulk of openings concentrated in production and automation roles. The Sub-Cluster exhibit below identifies where within the cluster the gap is most acute; the institution type display shows which sectors currently supply the workforce.
| Institution | Type | Total Grads (Raw) | Stay-in-State Rate | Adj. Graduates | % of Cluster Supply |
|---|---|---|---|---|---|
| Ohio State University-Main Campus | Public 4-Year | 2,693 | 38.8% | 598 | 14.8% |
| Columbus State Community College | Public 2-Year | 1,491 | 70.0% | 558 | 13.8% |
| Stark State College | Public 2-Year | 960 | 70.6% | 492 | 12.2% |
| University of Cincinnati-Main Campus | Public 4-Year | 1,696 | 54.5% | 484 | 12.0% |
| University of Akron Main Campus | Public 4-Year | 807 | 66.6% | 403 | 10.0% |
| Sinclair Community College | Public 2-Year | 1,596 | 47.2% | 346 | 8.6% |
| Edison State Community College | Public 2-Year | 491 | 79.8% | 331 | 8.2% |
| Ohio University-Main Campus | Public 4-Year | 1,107 | 51.7% | 305 | 7.6% |
| University of Toledo | Public 4-Year | 819 | 52.7% | 257 | 6.4% |
| University of Dayton | Private NFP 4-Year | 817 | 46.5% | 255 | 6.3% |
| # | CIP Code | Program | Primary Level | Adj. Graduates1 | % of Cluster Supply | # Institutions | # SOCs Served |
|---|---|---|---|---|---|---|---|
| 1 | 15.0399 | Electrical/Electronic Engineering Technologies/Technicians, Other | Associate's degree | 1,643 | 25.8% | 8 | 1 |
| 2 | 14.1901 | Mechanical Engineering | Associate's degree | 945 | 14.8% | 17 | 3 |
| 3 | 15.0403 | Electromechanical/Electromechanical Engineering Technology/Technician | Associate's degree | 766 | 12.0% | 11 | 2 |
| 4 | 15.0805 | Mechanical/Mechanical Engineering Technology/Technician | Associate's degree | 677 | 10.6% | 23 | 3 |
| 5 | 15.0303 | Electrical, Electronic, and Communications Engineering Technology/Technician | Associate's degree | 628 | 9.9% | 19 | 6 |
| 6 | 15.0613 | Manufacturing Engineering Technology/Technician | Associate's degree | 535 | 8.4% | 15 | 1 |
| 7 | 14.0701 | Chemical Engineering | Bachelor's degree | 346 | 5.4% | 11 | 2 |
| 8 | 14.1001 | Electrical and Electronics Engineering | Bachelor's degree | 343 | 5.4% | 16 | 3 |
| 9 | 14.0501 | Bioengineering and Biomedical Engineering | Bachelor's degree | 246 | 3.9% | 10 | 2 |
| 10 | 15.0614 | Welding Engineering Technology/Technician | Associate's degree | 236 | 3.7% | 3 | 2 |
| 1 Adjusted graduates reflect stay-in-state rate × CIP-SOC crosswalk weight; summed across SOCs within cluster. | |||||||
Agriculture
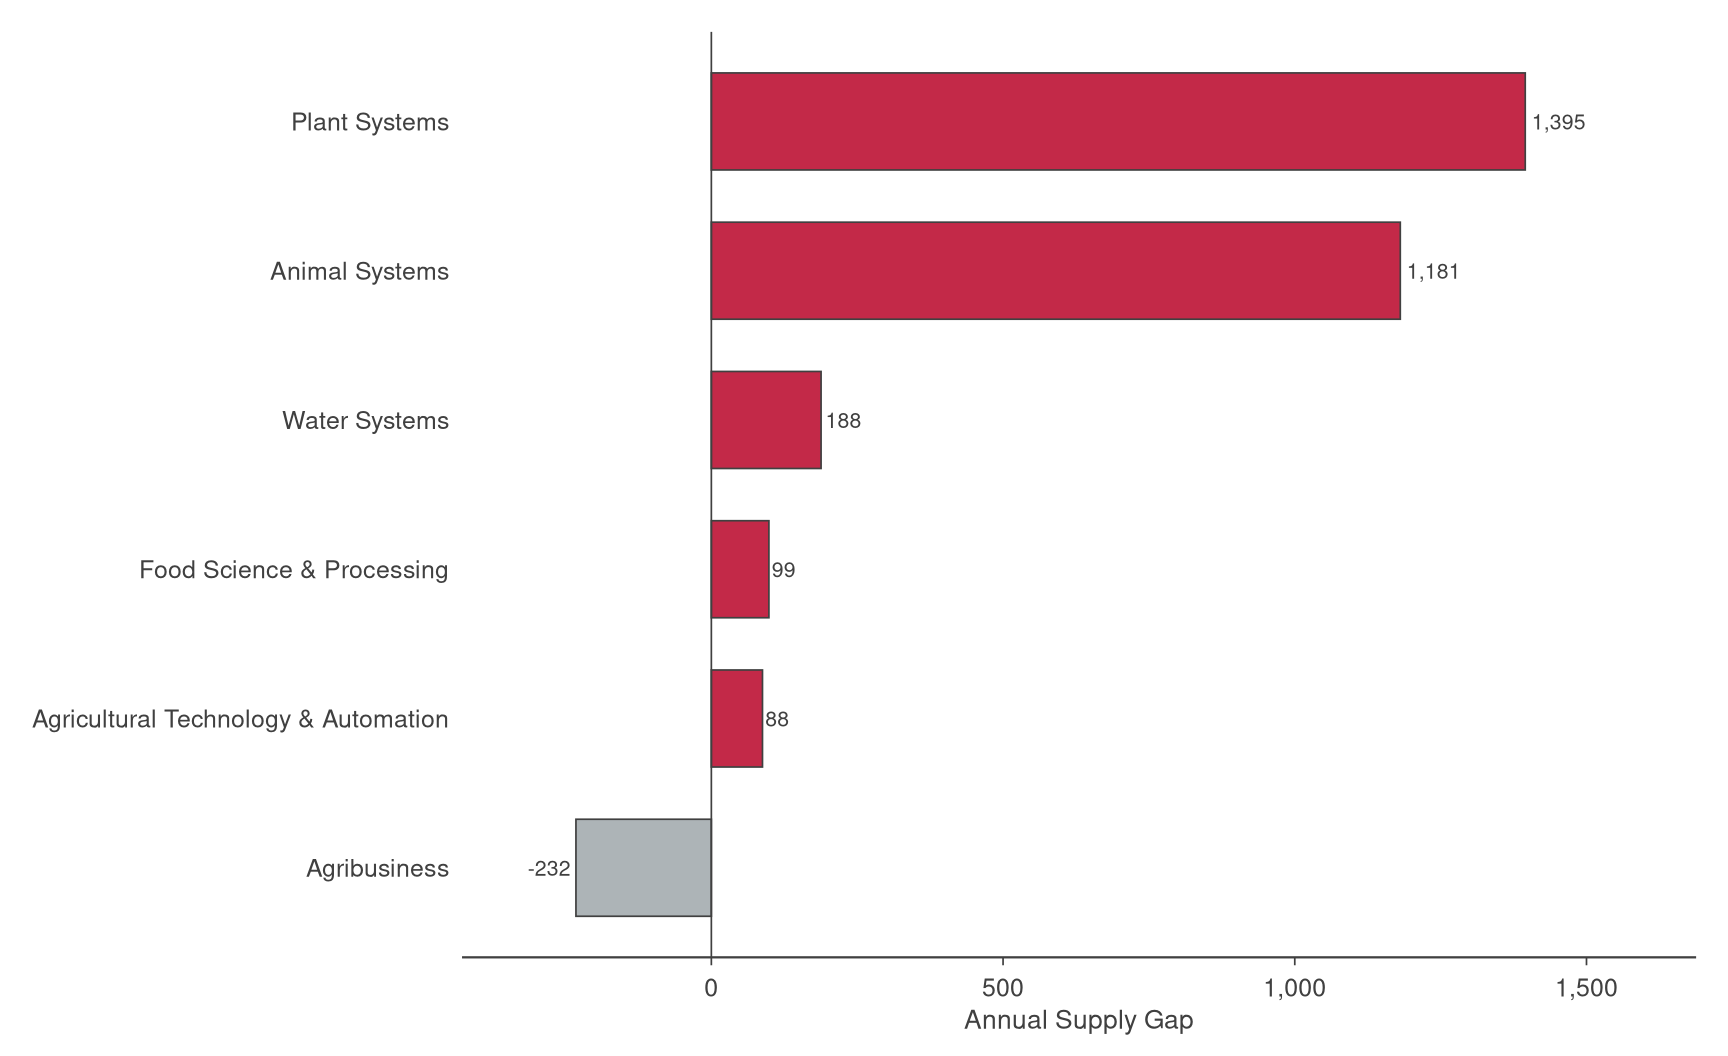
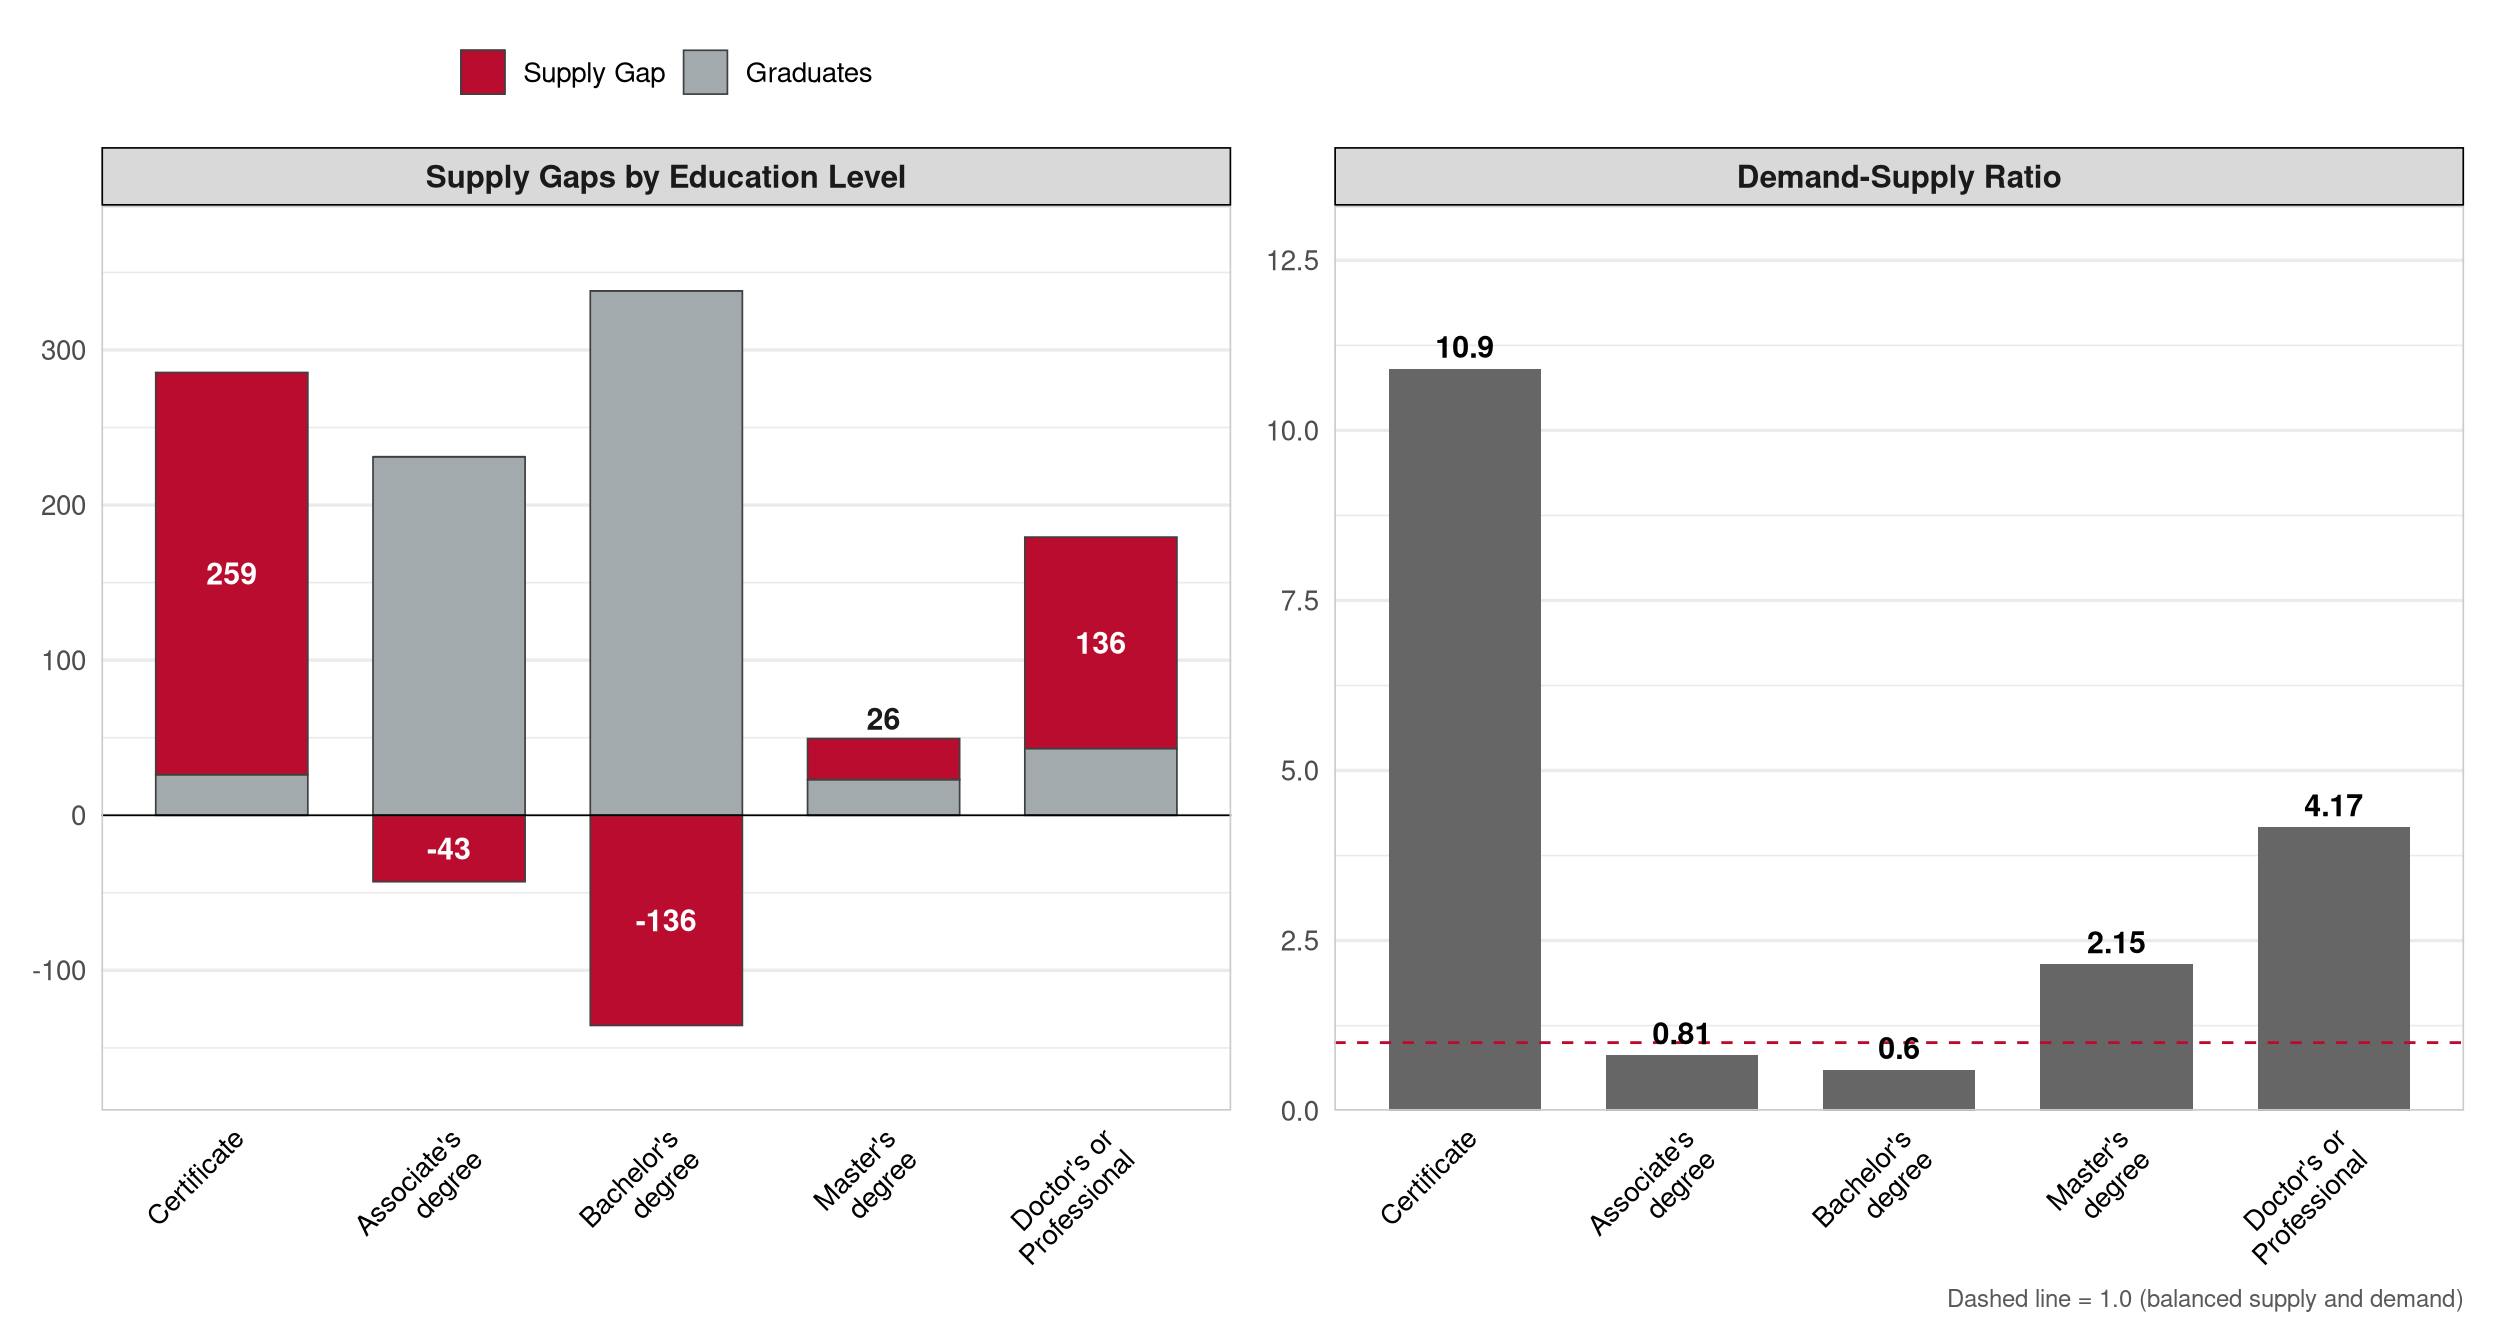
Agriculture includes agribusiness, agricultural technology and automation, animal systems, conservation and land management, food processing and distribution, and plant systems. This cluster has a low conversion rate, meaning postsecondary programs cover only a limited share of total occupational openings; many roles in this sector are filled through on-the-job pathways rather than formal higher education credentials. The measured supply gap reflects unmet demand within the postsecondary-aligned portion of the cluster. The demand-supply ratio should be interpreted with caution and weighed against the absolute gap rather than used as a primary severity indicator.
| Metric | Value |
|---|---|
| Sub-Clusters | Agribusiness; Agricultural Technology & Automation; Animal Systems; Food Science & Processing; Plant Systems; Water Systems |
| Adj. Graduates | 661 |
| Conversion Rate | 4.9% |
| Annual Supply Gap | 244 |
| Proj. Annual Growth | 118 |
| Total Employment | 21,274 |
| Total Earnings | $1.3B |
| Avg Earnings/Worker | $62,600 |
| D-S Ratio | 1.371 |
| 1 D-S ratio = annual demand ÷ adjusted graduate supply. This cluster has a conversion rate below 10%, indicating very limited higher-education pathways relative to total openings. The supply gap is the more reliable comparator. | |
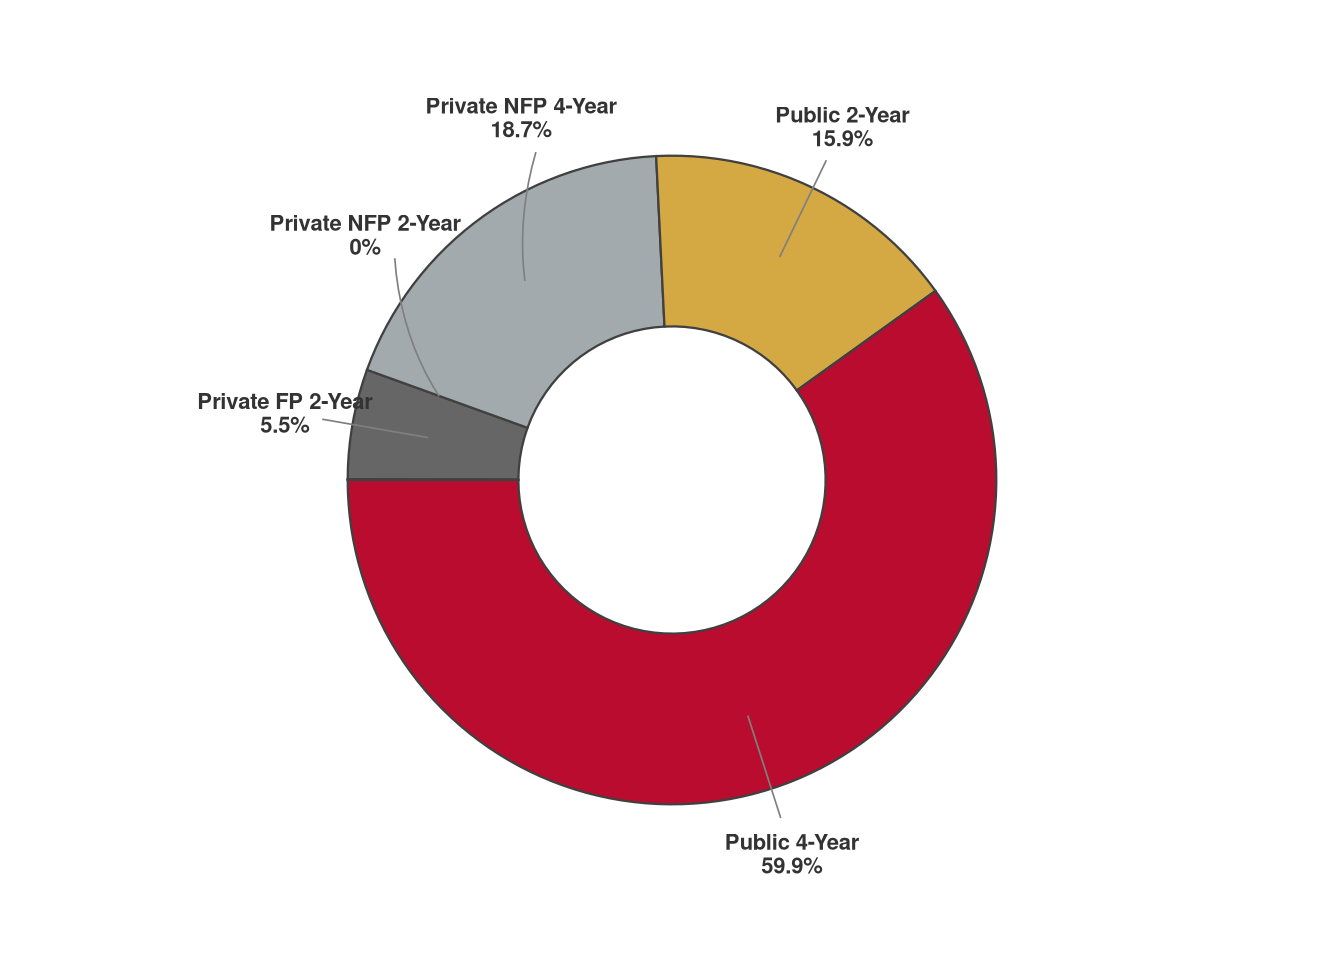
| Institution | Type | Total Grads (Raw) | Stay-in-State Rate | Adj. Graduates | % of Cluster Supply |
|---|---|---|---|---|---|
| Ohio State University-Main Campus | Public 4-Year | 1,635 | 42.6% | 245 | 48.1% |
| Ohio State University Agricultural Technical Institute | Public 4-Year | 126 | 64.6% | 67 | 13.2% |
| The University of Findlay | Private NFP 4-Year | 93 | 53.7% | 44 | 8.6% |
| Wilmington College | Private NFP 4-Year | 73 | 53.3% | 38 | 7.4% |
| Columbus State Community College | Public 2-Year | 57 | 82.3% | 37 | 7.3% |
| Hocking College | Public 2-Year | 62 | 46.1% | 20 | 3.9% |
| Valley College-Cleveland | Private FP 2-Year | 47 | 36.5% | 16 | 3.2% |
| University of Cincinnati-Blue Ash College | Public 4-Year | 69 | 48.6% | 15 | 2.9% |
| Kent State University at Tuscarawas | Public 4-Year | 29 | 66.3% | 15 | 2.9% |
| Sinclair Community College | Public 2-Year | 108 | 18.3% | 12 | 2.4% |
| # | CIP Code | Program | Primary Level | Adj. Graduates1 | % of Cluster Supply | # Institutions | # SOCs Served |
|---|---|---|---|---|---|---|---|
| 1 | 01.0901 | Animal Sciences, General | Associate's degree | 123 | 27.2% | 2 | 3 |
| 2 | 01.8301 | Veterinary/Animal Health Technology/Technician and Veterinary Assistant | Associate's degree | 100 | 22.1% | 8 | 2 |
| 3 | 01.0101 | Agricultural Business and Management, General | Associate's degree | 51 | 11.3% | 6 | 1 |
| 4 | 01.0507 | Equestrian/Equine Studies | Associate's degree | 36 | 8.0% | 4 | 1 |
| 5 | 01.8001 | Veterinary Medicine | Doctor's or Professional | 31 | 6.9% | 1 | 1 |
| 6 | 01.0103 | Agricultural Economics | Bachelor's degree | 31 | 6.8% | 2 | 1 |
| 7 | 26.0802 | Molecular Genetics | Bachelor's degree | 22 | 4.9% | 1 | 1 |
| 8 | 01.1101 | Plant Sciences, General | Bachelor's degree | 21 | 4.6% | 1 | 3 |
| 9 | 01.1001 | Food Science | Bachelor's degree | 20 | 4.4% | 1 | 2 |
| 10 | 40.0601 | Geology/Earth Science, General | Bachelor's degree | 17 | 3.8% | 20 | 1 |
| 1 Adjusted graduates reflect stay-in-state rate × CIP-SOC crosswalk weight; summed across SOCs within cluster. | |||||||
Arts, Entertainment, & Design
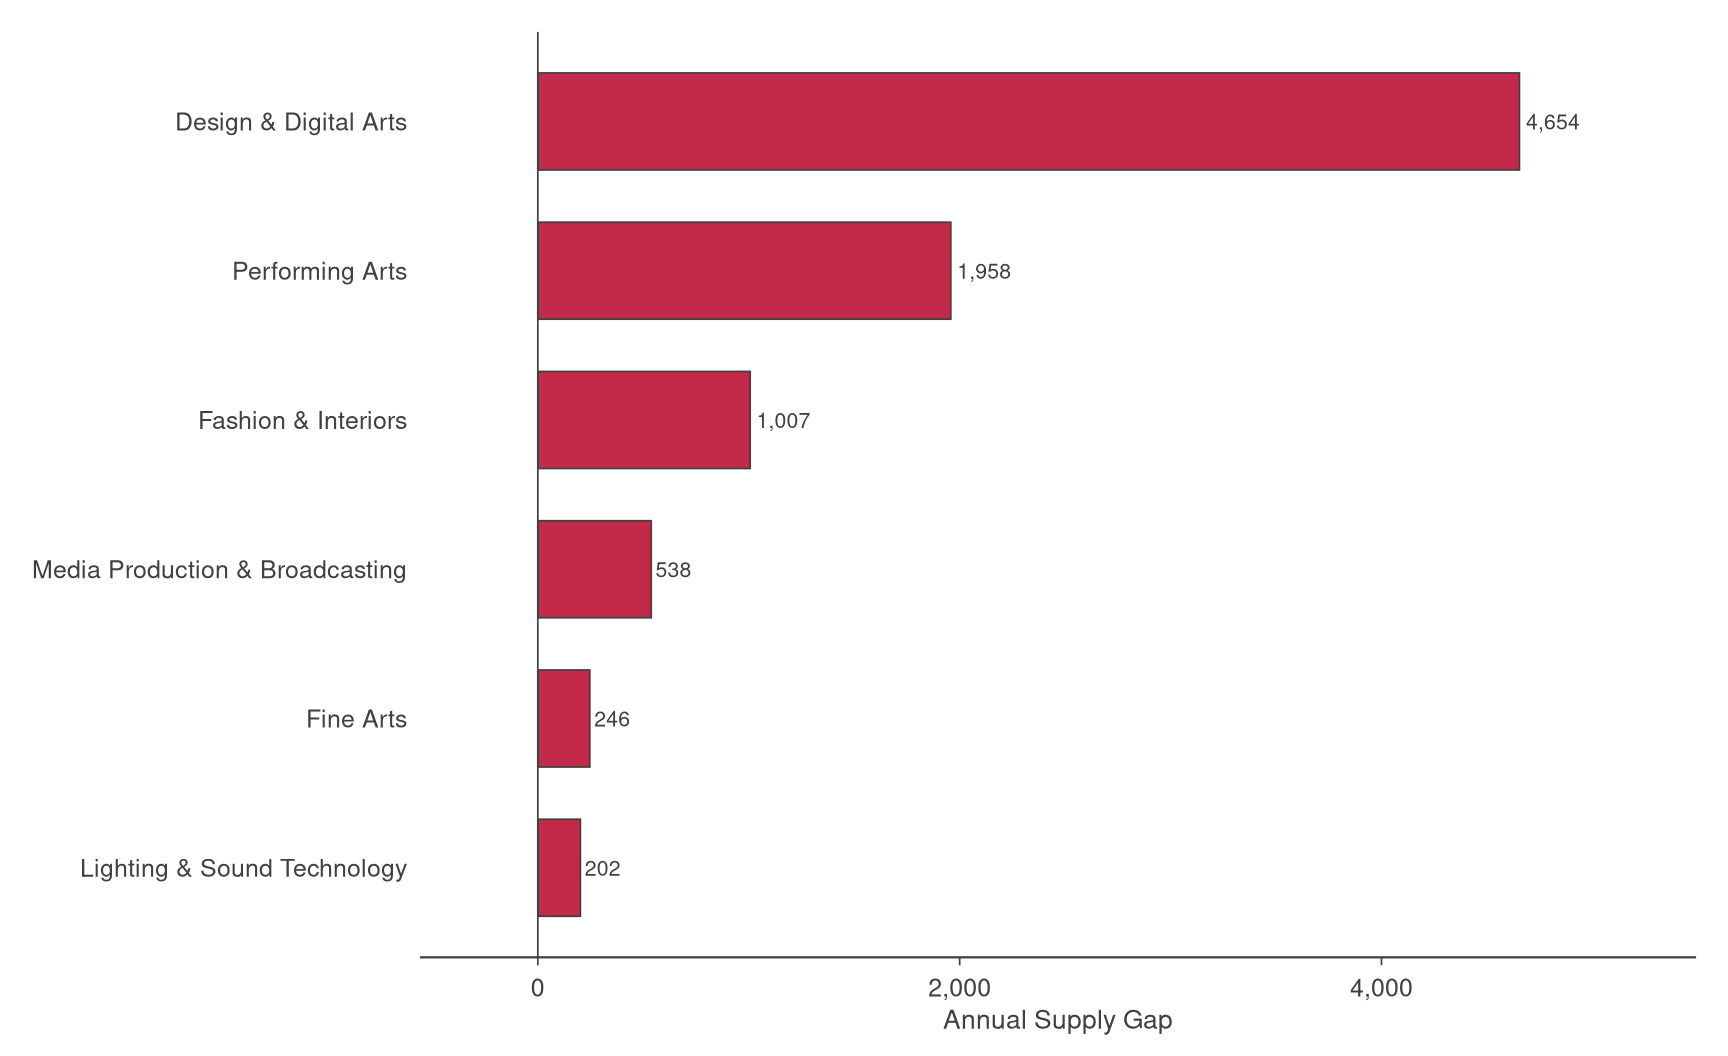
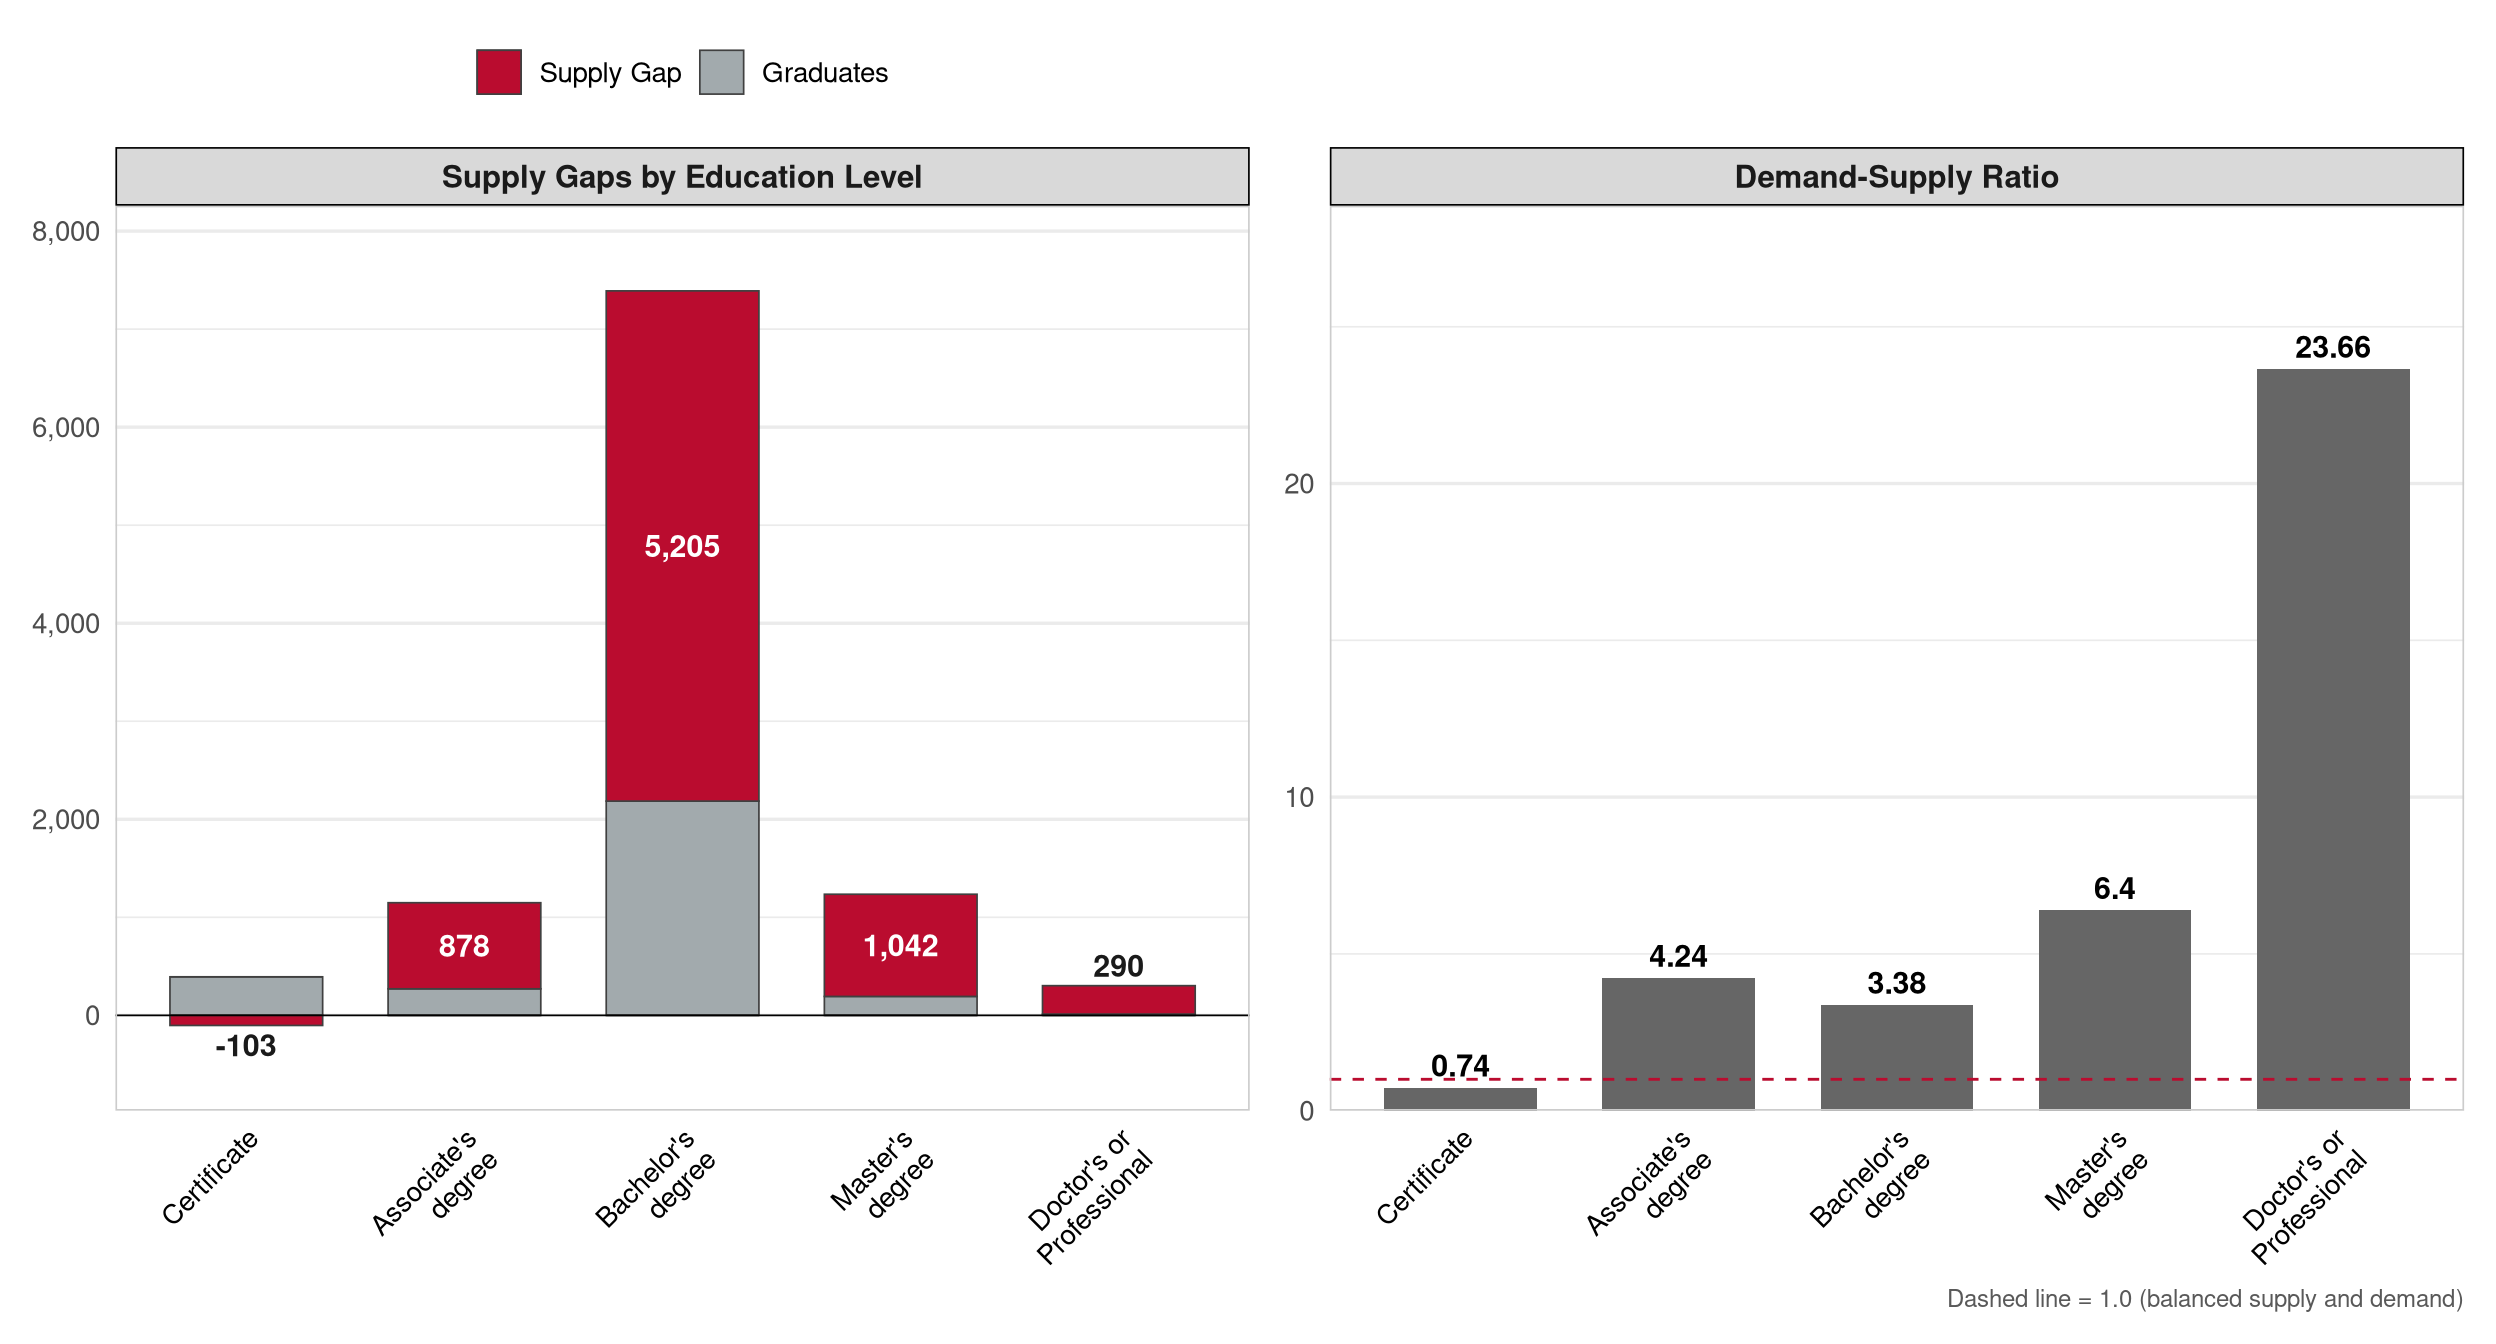
Arts, Entertainment, & Design spans design and digital arts, film and broadcast, interactive media, journalism and communications, performing arts, and visual arts. Graduate supply in this cluster is relatively close to demand in several Sub-Clusters, but the design and digital arts pathway shows a persistent gap driven in part by demand from technology-adjacent industries. The cluster carries a meaningful absolute gap of 7,316 and a modest total earnings footprint relative to other undersupplied clusters; program targeting in this space should account for the degree to which design graduates serve adjacent technology and media sectors beyond the cluster’s direct occupational definition. In the Advance CTE framework mapping, the design & digital arts Sub-Cluster pulls in technology-adjacent occupations (graphic designers, multimedia artists, web developers, producers) that carry substantially higher wages than performing arts or fine arts roles. Because the framework maps these occupations into the Arts cluster, the average is anchored upward by those higher-wage design and media-tech roles.
| Metric | Value |
|---|---|
| Sub-Clusters | Design & Digital Arts; Fashion & Interiors; Fine Arts; Lighting & Sound Technology; Media Production & Broadcasting; Performing Arts |
| Adj. Graduates | 3,051 |
| Conversion Rate | 13.6% |
| Annual Supply Gap | 7,316 |
| Proj. Annual Growth | 1,096 |
| Total Employment | 143,043 |
| Total Earnings | $13B |
| Avg Earnings/Worker | $90,800 |
| D-S Ratio | 3.40 |
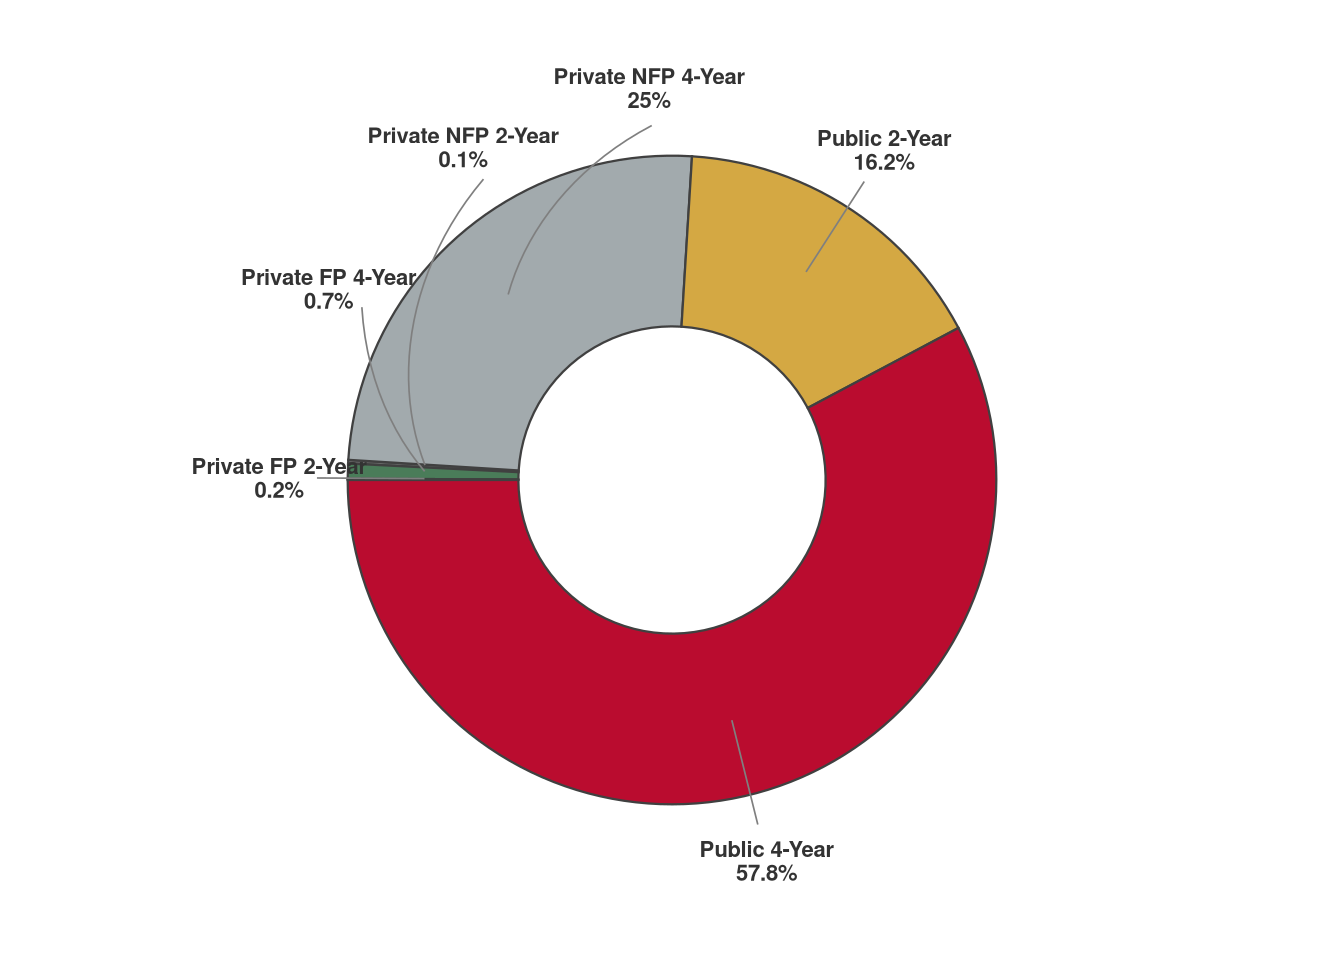
| Institution | Type | Total Grads (Raw) | Stay-in-State Rate | Adj. Graduates | % of Cluster Supply |
|---|---|---|---|---|---|
| University of Cincinnati-Main Campus | Public 4-Year | 1,312 | 45.3% | 365 | 19.7% |
| Ohio University-Main Campus | Public 4-Year | 1,069 | 41.2% | 252 | 13.6% |
| Kent State University at Kent | Public 4-Year | 863 | 52.9% | 229 | 12.4% |
| Ohio State University-Main Campus | Public 4-Year | 1,257 | 54.7% | 228 | 12.3% |
| Bowling Green State University-Main Campus | Public 4-Year | 695 | 46.8% | 201 | 10.9% |
| Columbus State Community College | Public 2-Year | 648 | 48.4% | 178 | 9.6% |
| Miami University-Oxford | Public 4-Year | 567 | 34.2% | 146 | 7.9% |
| Sinclair Community College | Public 2-Year | 342 | 53.8% | 89 | 4.8% |
| University of Akron Main Campus | Public 4-Year | 224 | 58.0% | 82 | 4.4% |
| Oberlin College | Private NFP 4-Year | 278 | 42.5% | 81 | 4.4% |
| # | CIP Code | Program | Primary Level | Adj. Graduates1 | % of Cluster Supply | # Institutions | # SOCs Served |
|---|---|---|---|---|---|---|---|
| 1 | 31.0504 | Sport and Fitness Administration/Management | Associate's degree | 401 | 24.8% | 43 | 1 |
| 2 | 09.0702 | Digital Communication and Media/Multimedia | Associate's degree | 195 | 12.1% | 15 | 2 |
| 3 | 11.0201 | Computer Programming/Programmer, General | Associate's degree | 181 | 11.2% | 11 | 2 |
| 4 | 09.0101 | Speech Communication and Rhetoric | Associate's degree | 167 | 10.3% | 29 | 2 |
| 5 | 50.0903 | Music Performance, General | Bachelor's degree | 144 | 8.9% | 23 | 2 |
| 6 | 09.0401 | Journalism | Bachelor's degree | 144 | 8.9% | 12 | 4 |
| 7 | 09.0701 | Radio and Television | Associate's degree | 109 | 6.8% | 6 | 4 |
| 8 | 50.0101 | Visual and Performing Arts, General | Bachelor's degree | 107 | 6.6% | 6 | 3 |
| 9 | 23.1302 | Creative Writing | Associate's degree | 86 | 5.3% | 17 | 2 |
| 10 | 50.0402 | Commercial and Advertising Art | Associate's degree | 82 | 5.0% | 7 | 1 |
| 1 Adjusted graduates reflect stay-in-state rate × CIP-SOC crosswalk weight; summed across SOCs within cluster. | |||||||
Construction
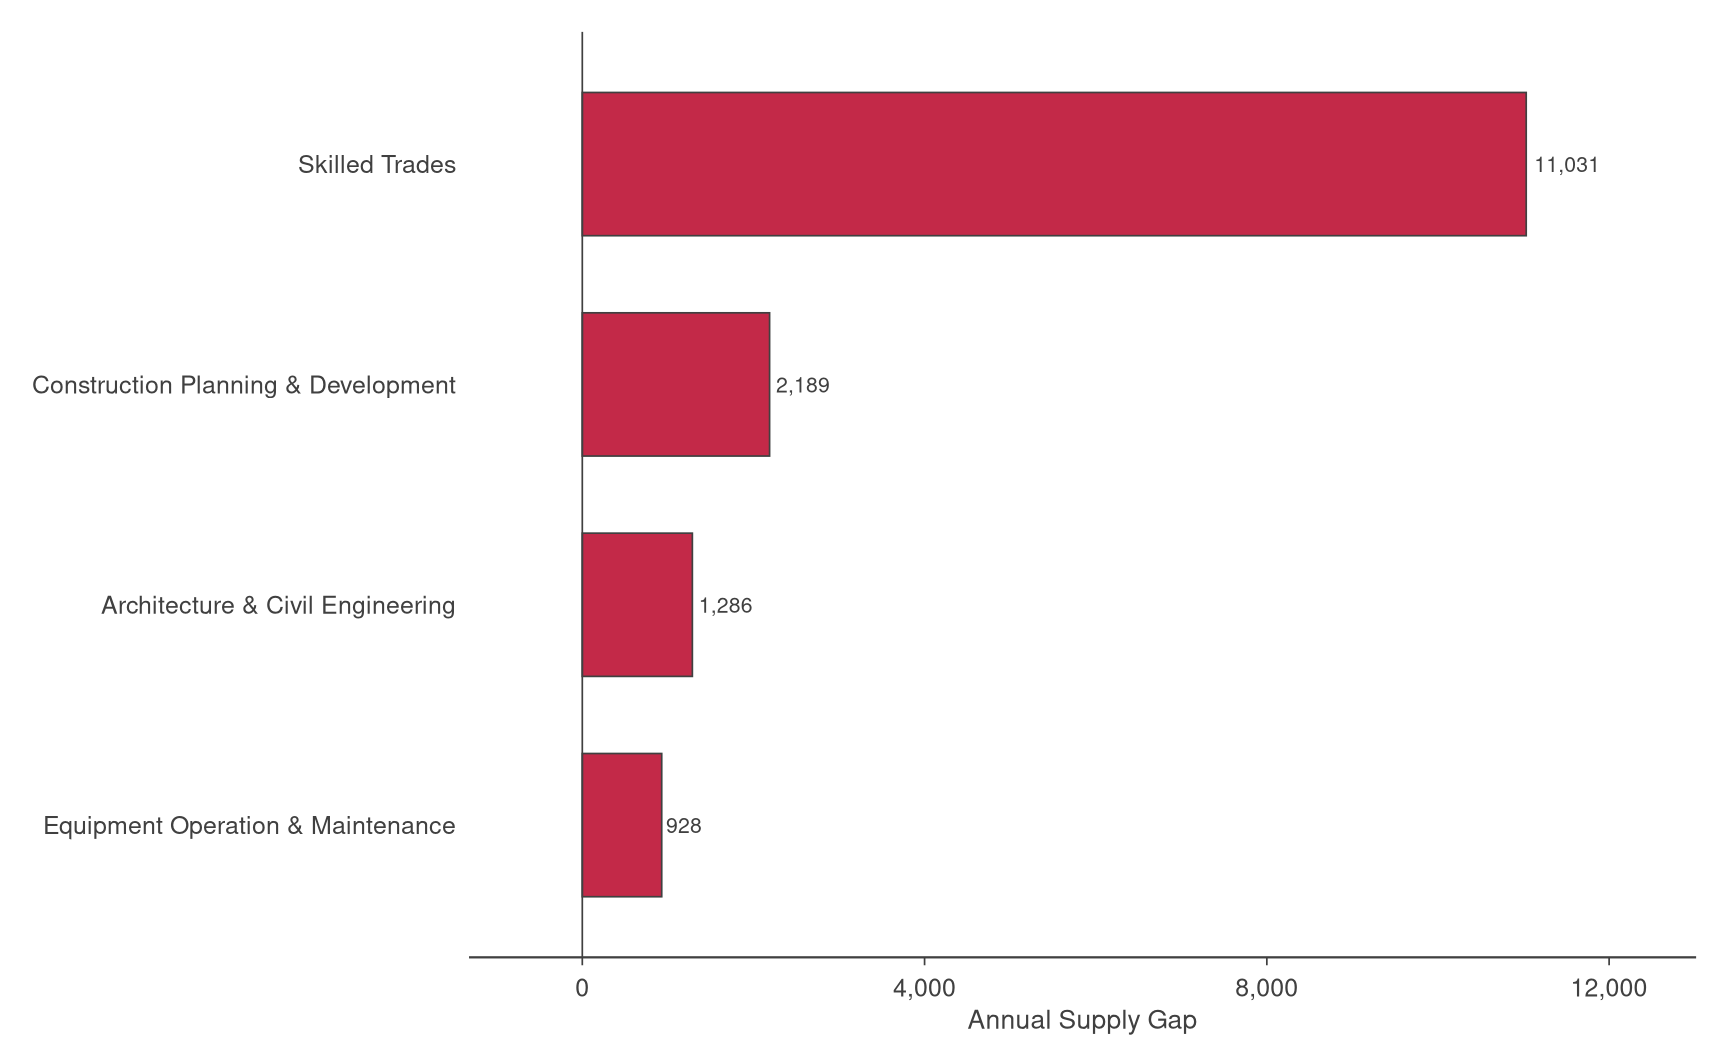
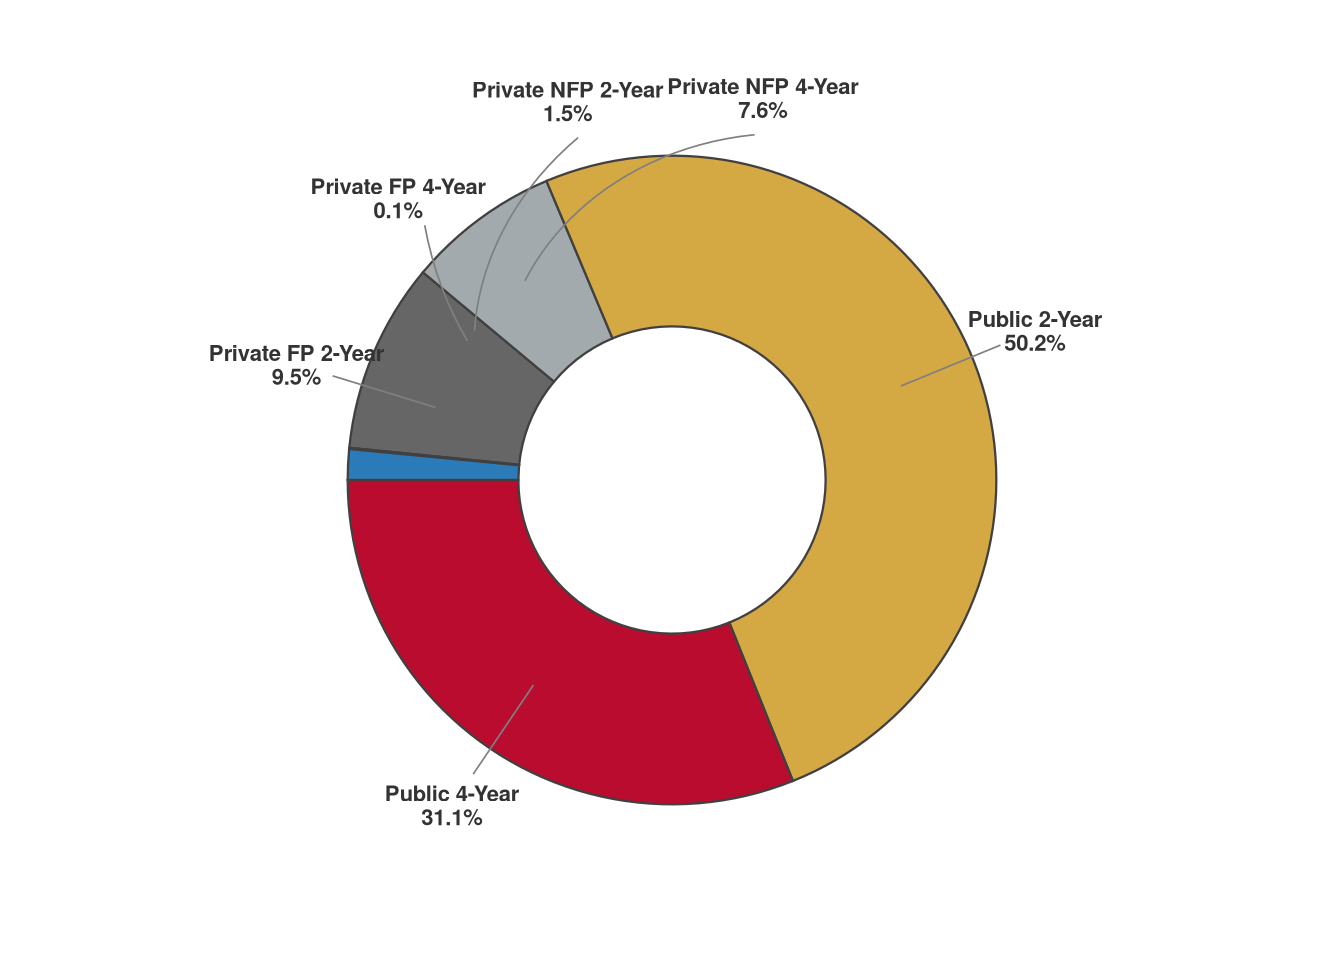
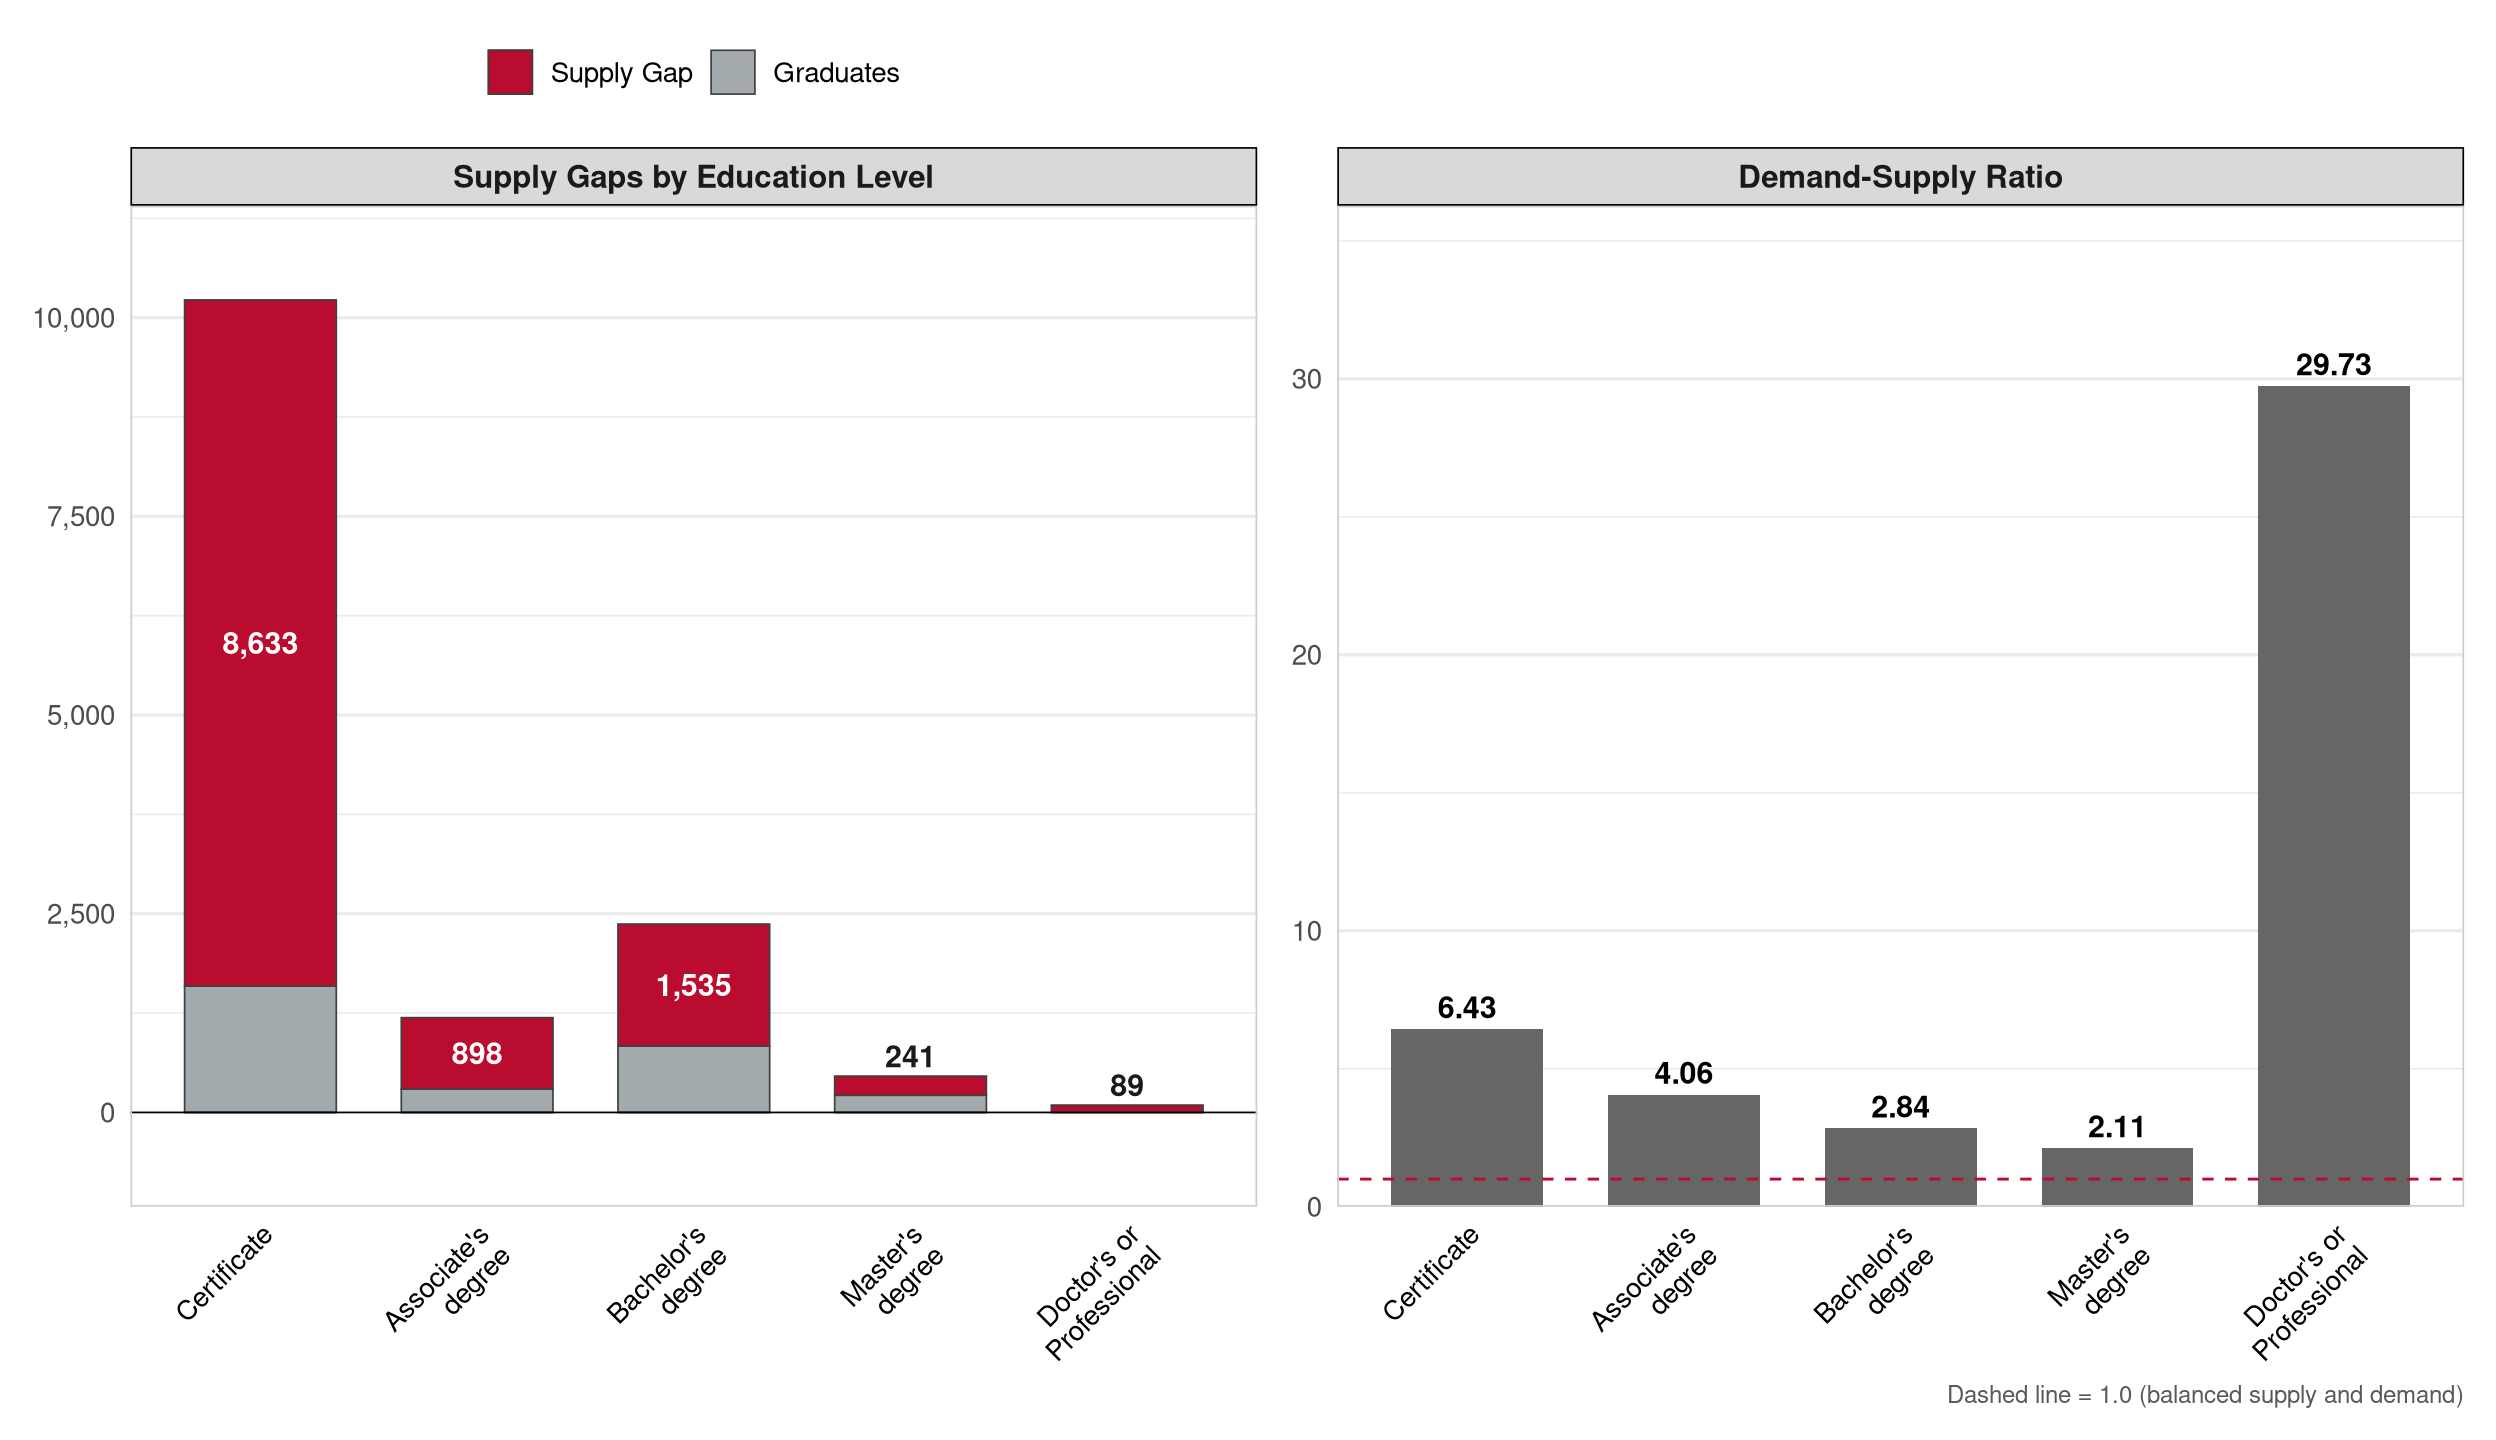
Construction includes architecture and civil engineering, construction management, construction planning and development, and skilled trades. Demand is concentrated in sub-baccalaureate pathways, reflecting the skilled-trades composition of the sector; two-year institutions and certificate programs are the primary supply channel for most construction occupations. This concentration means that changes in associate and certificate program capacity have an outsized effect on the cluster’s supply-demand balance relative to four-year program expansion. The supply gap by education level exhibit shows a very large demand-supply ratio at the doctoral/doctor’s or professional level; this reflects a methodological artifact rather than a genuine workforce signal. A small share of workers in managerial and supervisory construction occupations hold doctoral/doctor’s degrees, and O*NET assigns a correspondingly small but non-zero weight to those occupations at that credential level. Because essentially no Ohio graduates are routed to construction occupations through doctoral/doctor’s programs as currently defined, the resulting ratio appears extreme but carries no policy interpretation. Note how small the total supply and demand bars are on the left bar chart.
| Metric | Value |
|---|---|
| Sub-Clusters | Architecture & Civil Engineering; Construction Planning & Development; Equipment Operation & Maintenance; Skilled Trades |
| Adj. Graduates | 2,614 |
| Conversion Rate | 9.0% |
| Annual Supply Gap | 11,722 |
| Proj. Annual Growth | 448 |
| Total Employment | 332,056 |
| Total Earnings | $22.9B |
| Avg Earnings/Worker | $68,900 |
| D-S Ratio | 5.481 |
| 1 D-S ratio = annual demand ÷ adjusted graduate supply. This cluster has a conversion rate below 10%, indicating very limited higher-education pathways relative to total openings. The supply gap is the more reliable comparator. | |
| Institution | Type | Total Grads (Raw) | Stay-in-State Rate | Adj. Graduates | % of Cluster Supply |
|---|---|---|---|---|---|
| Columbus State Community College | Public 2-Year | 844 | 80.0% | 416 | 24.7% |
| Stark State College | Public 2-Year | 581 | 73.7% | 305 | 18.1% |
| Ohio State University-Main Campus | Public 4-Year | 706 | 51.6% | 172 | 10.2% |
| University of Cincinnati-Main Campus | Public 4-Year | 832 | 56.4% | 165 | 9.8% |
| Owens Community College | Public 2-Year | 352 | 66.2% | 136 | 8.1% |
| Kent State University at Kent | Public 4-Year | 576 | 56.0% | 129 | 7.6% |
| Sinclair Community College | Public 2-Year | 1,177 | 47.8% | 121 | 7.2% |
| University of Akron Main Campus | Public 4-Year | 224 | 72.2% | 91 | 5.4% |
| Lorain County Community College | Public 2-Year | 491 | 48.0% | 85 | 5.0% |
| Cleveland State University | Public 4-Year | 429 | 70.4% | 66 | 3.9% |
| # | CIP Code | Program | Primary Level | Adj. Graduates1 | % of Cluster Supply | # Institutions | # SOCs Served |
|---|---|---|---|---|---|---|---|
| 1 | 52.0201 | Business Administration and Management, General | Associate's degree | 419 | 19.1% | 55 | 2 |
| 2 | 14.0801 | Civil Engineering, General | Bachelor's degree | 332 | 15.1% | 12 | 2 |
| 3 | 48.0508 | Welding Technology/Welder | Associate's degree | 322 | 14.6% | 19 | 2 |
| 4 | 15.0614 | Welding Engineering Technology/Technician | Associate's degree | 236 | 10.7% | 3 | 2 |
| 5 | 46.0503 | Plumbing Technology/Plumber | Associate's degree | 201 | 9.1% | 3 | 2 |
| 6 | 47.0201 | Heating, Air Conditioning, Ventilation and Refrigeration Maintenance Technology/Technician | Associate's degree | 182 | 8.3% | 11 | 1 |
| 7 | 15.1001 | Construction Engineering Technology/Technician | Associate's degree | 180 | 8.2% | 10 | 2 |
| 8 | 04.0201 | Architecture | Bachelor's degree | 123 | 5.6% | 4 | 2 |
| 9 | 52.0205 | Operations Management and Supervision | Associate's degree | 106 | 4.8% | 10 | 2 |
| 10 | 15.0501 | Heating, Ventilation, Air Conditioning and Refrigeration Engineering Technology/Technician | Associate's degree | 98 | 4.5% | 9 | 1 |
| 1 Adjusted graduates reflect stay-in-state rate × CIP-SOC crosswalk weight; summed across SOCs within cluster. | |||||||
Digital Technology
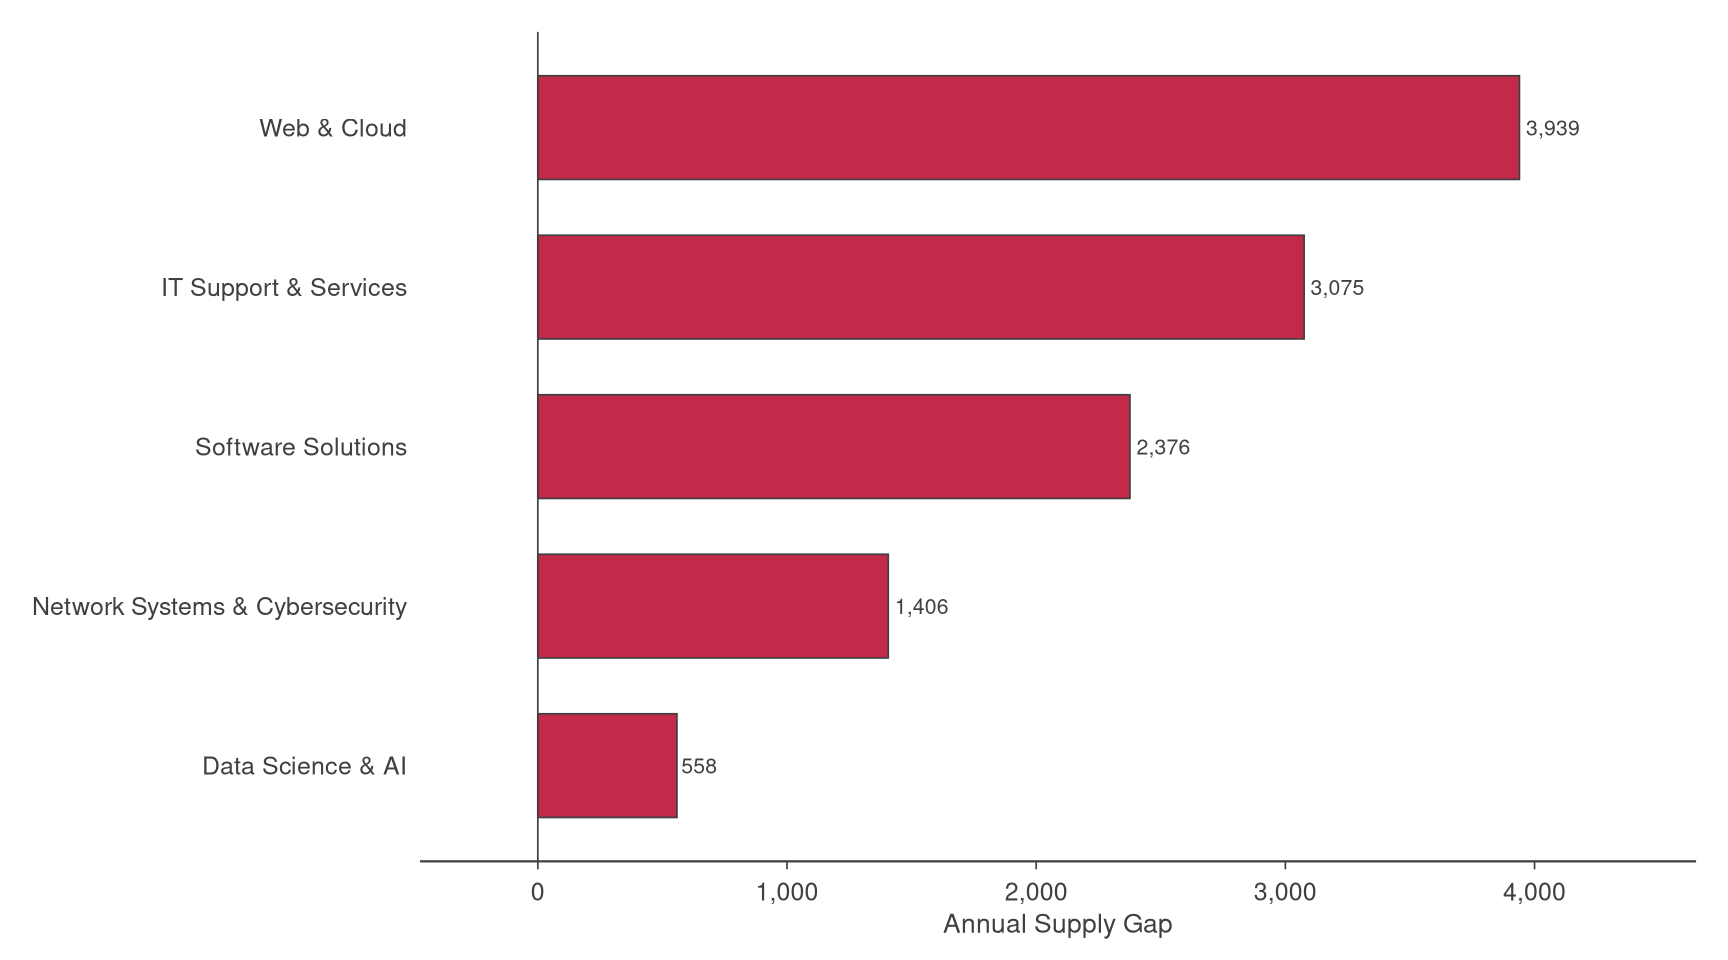
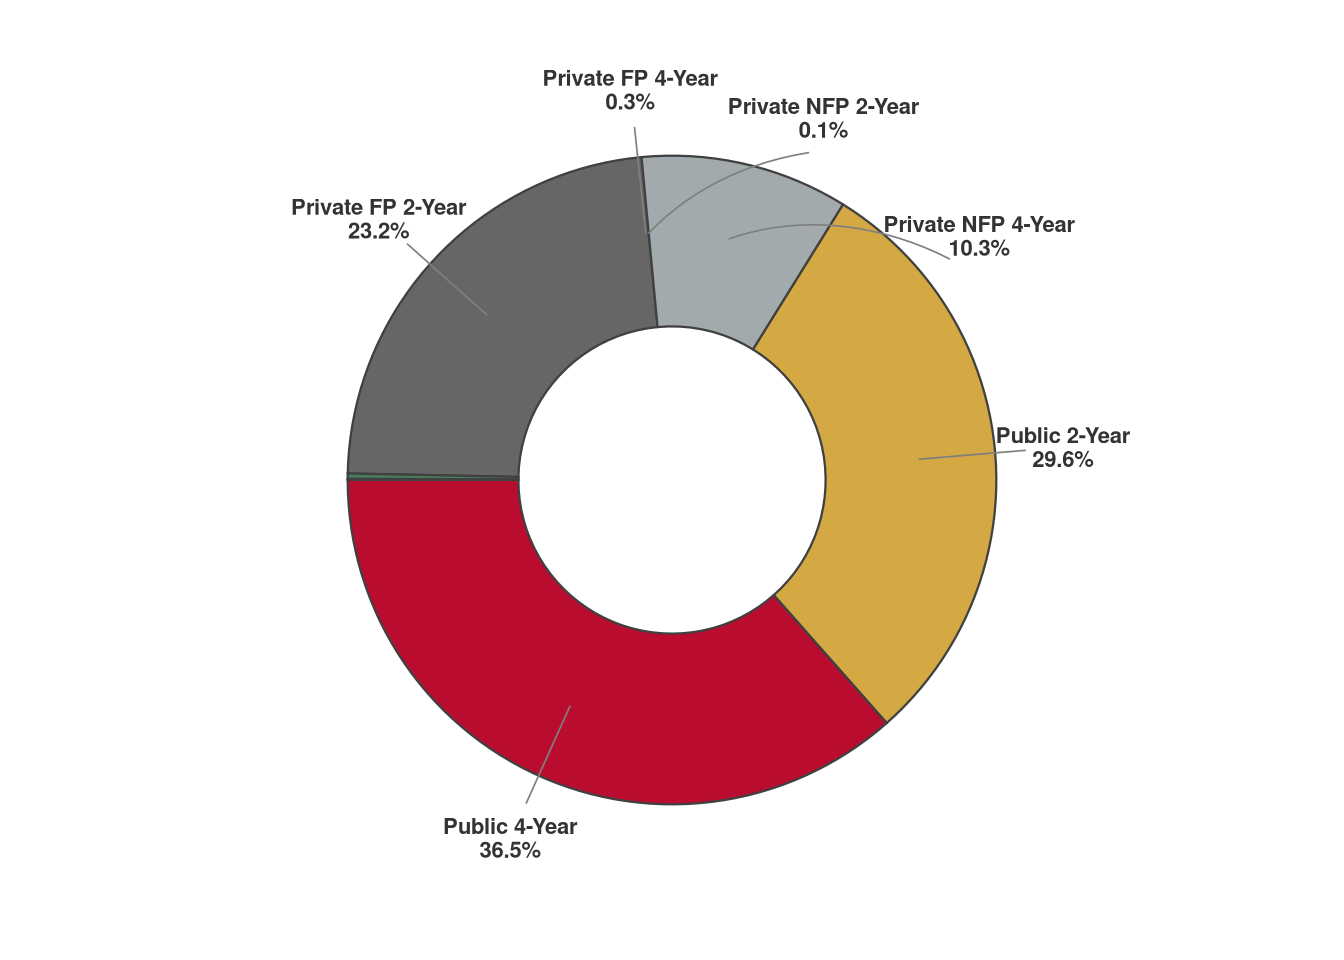
Digital Technology covers cybersecurity, data science and artificial intelligence, IT infrastructure, software and web development, and technology management. This cluster carries a comparatively modest absolute supply gap of 3,219 but combines that gap with the second-fastest projected annual growth among all 14 clusters (1,633 net new positions). In addition, the cluster has the highest average earnings per worker in the state at approximately $102,500, barely above Energy & Natural Resources at $101,200. The combination of strong forward-looking demand and high wage levels places Digital Technology among clusters with the strongest economic returns to closing the gap, even where the absolute gap ranks below most other clusters. The Software Solutions, Web & Cloud, and Network Systems & Cybersecurity Sub-Clusters drive most of the unmet demand, and the cluster draws graduates from a relatively broad set of institution types.
| Metric | Value |
|---|---|
| Sub-Clusters | Data Science & AI; IT Support & Services; Network Systems & Cybersecurity; Software Solutions; Web & Cloud |
| Adj. Graduates | 7,693 |
| Conversion Rate | 9.0% |
| Annual Supply Gap | 3,219 |
| Proj. Annual Growth | 1,633 |
| Total Employment | 170,393 |
| Total Earnings | $17.5B |
| Avg Earnings/Worker | $102,500 |
| D-S Ratio | 1.421 |
| 1 D-S ratio = annual demand ÷ adjusted graduate supply. This cluster has a conversion rate below 10%, indicating very limited higher-education pathways relative to total openings. The supply gap is the more reliable comparator. | |
| Institution | Type | Total Grads (Raw) | Stay-in-State Rate | Adj. Graduates | % of Cluster Supply |
|---|---|---|---|---|---|
| MyComputerCareer at Columbus | Private FP 2-Year | 3,134 | 58.8% | 1,844 | 34.3% |
| University of Cincinnati-Main Campus | Public 4-Year | 2,103 | 69.3% | 957 | 17.8% |
| Sinclair Community College | Public 2-Year | 868 | 66.8% | 552 | 10.3% |
| Ohio State University-Main Campus | Public 4-Year | 2,069 | 42.7% | 394 | 7.3% |
| Columbus State Community College | Public 2-Year | 671 | 66.8% | 388 | 7.2% |
| Stark State College | Public 2-Year | 522 | 60.1% | 301 | 5.6% |
| Lakeland Community College | Public 2-Year | 416 | 60.9% | 253 | 4.7% |
| Cuyahoga Community College District | Public 2-Year | 482 | 58.2% | 244 | 4.5% |
| Cleveland State University | Public 4-Year | 665 | 46.9% | 238 | 4.4% |
| Miami University-Oxford | Public 4-Year | 750 | 54.8% | 208 | 3.9% |
| # | CIP Code | Program | Primary Level | Adj. Graduates1 | % of Cluster Supply | # Institutions | # SOCs Served |
|---|---|---|---|---|---|---|---|
| 1 | 11.0901 | Computer Systems Networking and Telecommunications | Associate's degree | 1,494 | 24.0% | 12 | 5 |
| 2 | 11.1003 | Computer and Information Systems Security/Auditing/Information Assurance | Associate's degree | 940 | 15.1% | 15 | 7 |
| 3 | 11.0101 | Computer and Information Sciences, General | Associate's degree | 882 | 14.2% | 19 | 10 |
| 4 | 11.0701 | Computer Science | Associate's degree | 728 | 11.7% | 32 | 12 |
| 5 | 11.0103 | Information Technology | Associate's degree | 536 | 8.6% | 11 | 9 |
| 6 | 11.0401 | Information Science/Studies | Associate's degree | 433 | 7.0% | 6 | 6 |
| 7 | 14.0901 | Computer Engineering, General | Bachelor's degree | 404 | 6.5% | 15 | 5 |
| 8 | 11.0201 | Computer Programming/Programmer, General | Associate's degree | 370 | 5.9% | 11 | 6 |
| 9 | 11.0202 | Computer Programming, Specific Applications | Associate's degree | 253 | 4.1% | 15 | 3 |
| 10 | 52.1201 | Management Information Systems, General | Associate's degree | 188 | 3.0% | 14 | 3 |
| 1 Adjusted graduates reflect stay-in-state rate × CIP-SOC crosswalk weight; summed across SOCs within cluster. | |||||||
Education
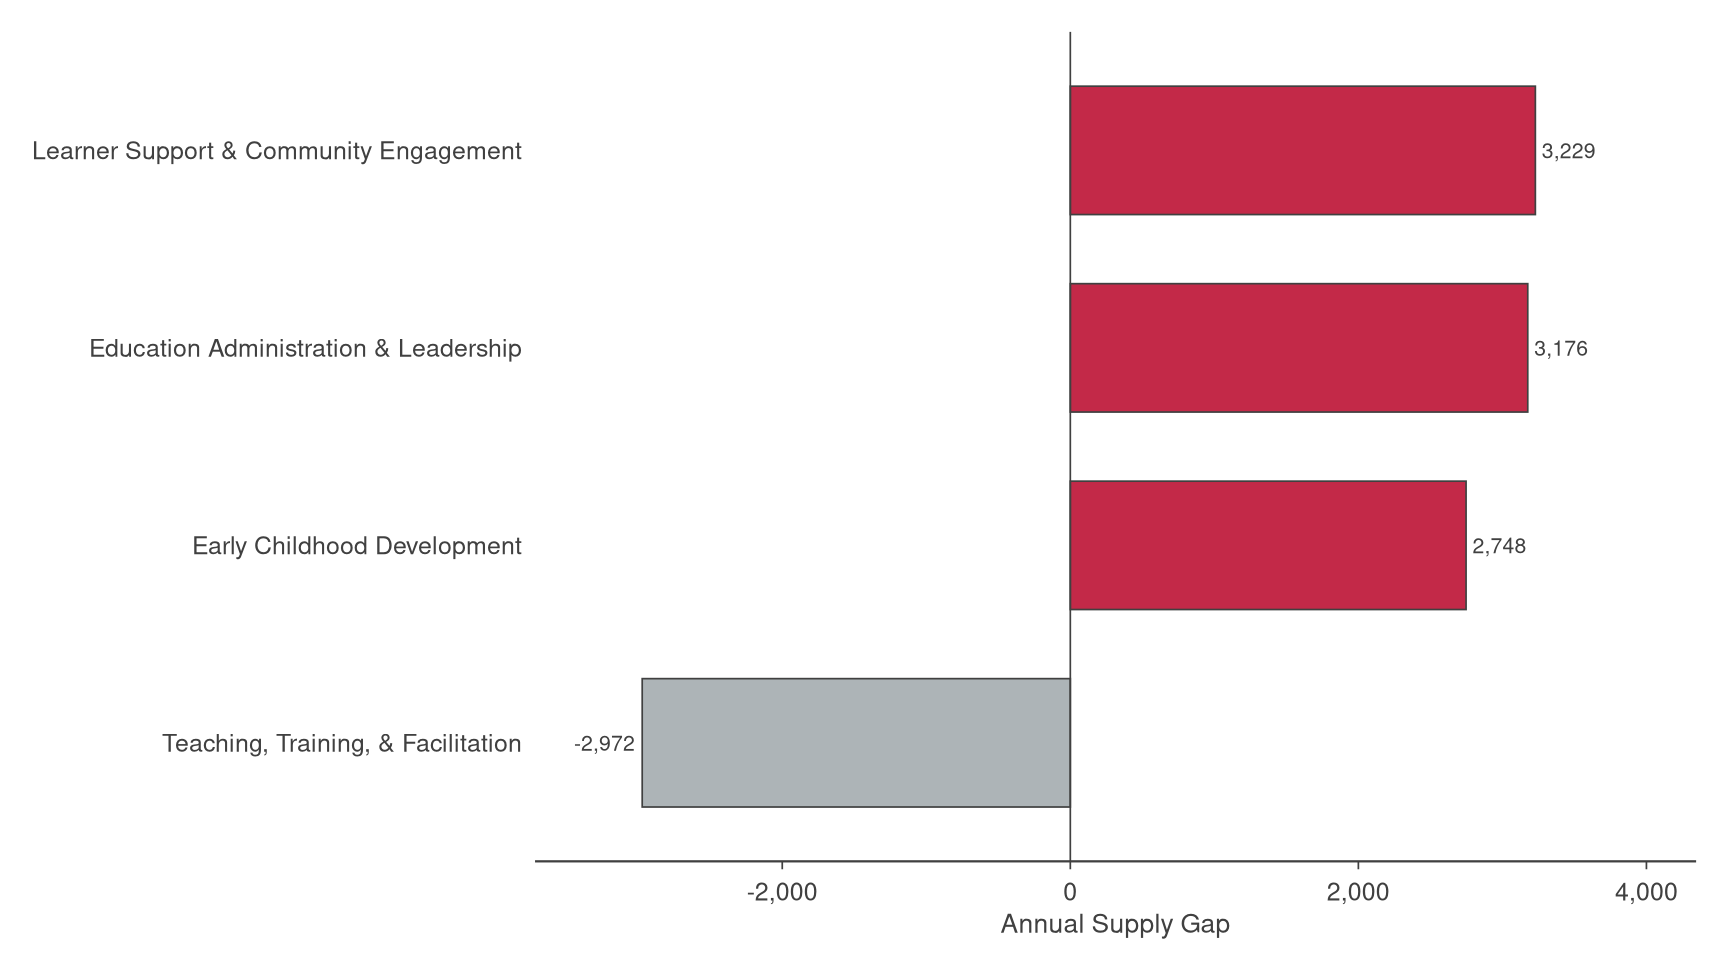
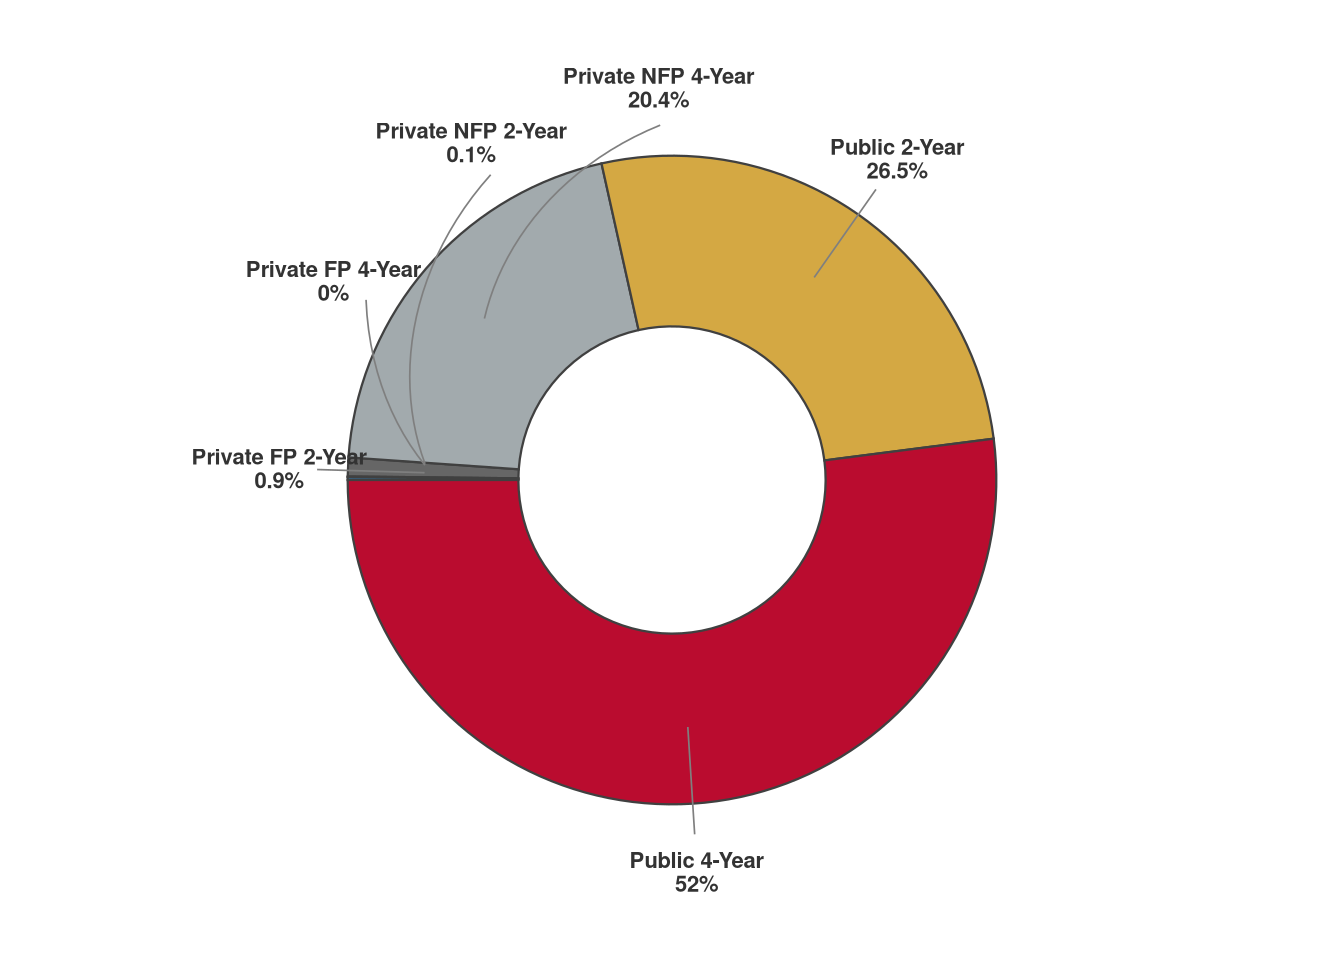
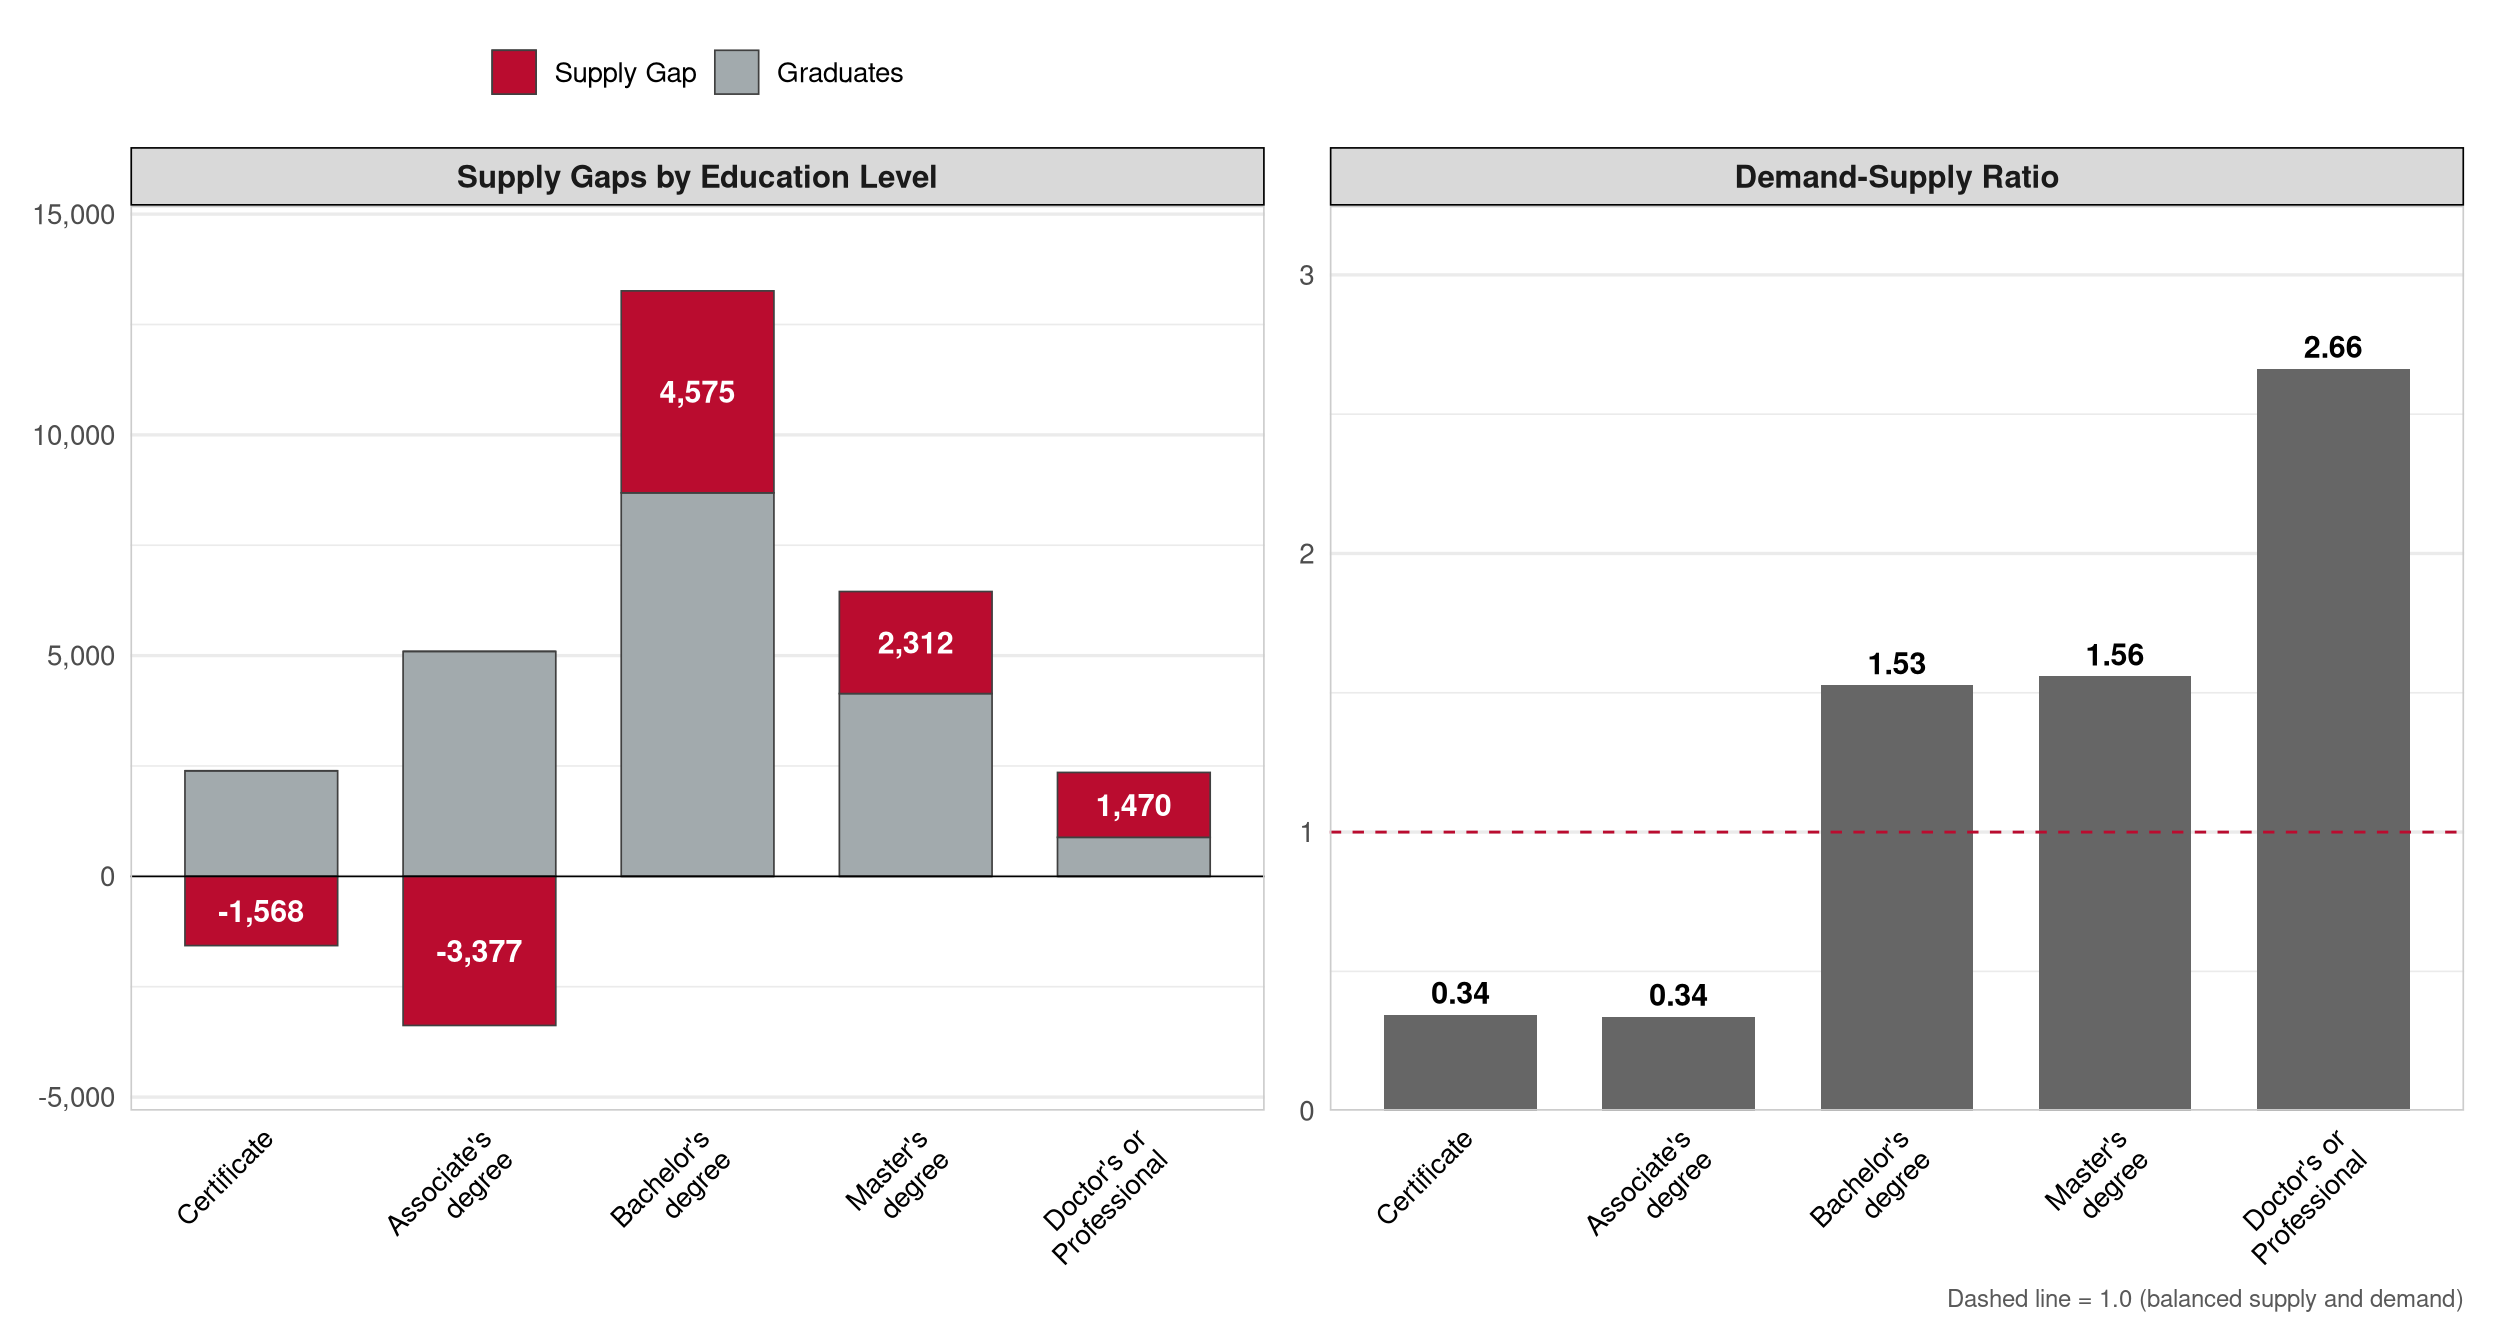
Education encompasses early childhood development, education support services, health data and administration, and teaching and instruction. Ohio faces persistent shortages in teaching and instruction pathways, with demand driven by both replacement needs in K–12 and postsecondary settings and by ongoing enrollment growth in early childhood contexts. Public four-year institutions supply most graduates in this cluster. The health data and administration Sub-Cluster, while smaller in absolute terms, draws graduates from a mix of institution types and reflects growing demand at the intersection of education and health informatics.
| Metric | Value |
|---|---|
| Sub-Clusters | Early Childhood Development; Education Administration & Leadership; Learner Support & Community Engagement; Teaching, Training, & Facilitation |
| Adj. Graduates | 21,197 |
| Conversion Rate | 16.3% |
| Annual Supply Gap | 3,411 |
| Proj. Annual Growth | 1,026 |
| Total Employment | 351,464 |
| Total Earnings | $24.4B |
| Avg Earnings/Worker | $69,500 |
| D-S Ratio | 1.16 |
| Institution | Type | Total Grads (Raw) | Stay-in-State Rate | Adj. Graduates | % of Cluster Supply |
|---|---|---|---|---|---|
| Ohio State University-Main Campus | Public 4-Year | 12,566 | 48.3% | 1,922 | 18.4% |
| University of Cincinnati-Main Campus | Public 4-Year | 9,143 | 54.4% | 1,395 | 13.4% |
| Cuyahoga Community College District | Public 2-Year | 2,726 | 61.8% | 1,239 | 11.9% |
| Kent State University at Kent | Public 4-Year | 4,624 | 57.9% | 1,106 | 10.6% |
| Ohio University-Main Campus | Public 4-Year | 6,139 | 55.5% | 930 | 8.9% |
| Bowling Green State University-Main Campus | Public 4-Year | 3,180 | 58.5% | 895 | 8.6% |
| Columbus State Community College | Public 2-Year | 2,140 | 56.9% | 864 | 8.3% |
| Sinclair Community College | Public 2-Year | 2,606 | 48.7% | 767 | 7.4% |
| Miami University-Oxford | Public 4-Year | 4,179 | 42.9% | 667 | 6.4% |
| Cleveland State University | Public 4-Year | 3,308 | 63.9% | 648 | 6.2% |
| # | CIP Code | Program | Primary Level | Adj. Graduates1 | % of Cluster Supply | # Institutions | # SOCs Served |
|---|---|---|---|---|---|---|---|
| 1 | 24.0101 | Liberal Arts and Sciences/Liberal Studies | Associate's degree | 3,511 | 35.7% | 33 | 1 |
| 2 | 24.0102 | General Studies | Associate's degree | 1,310 | 13.3% | 36 | 1 |
| 3 | 26.0101 | Biology/Biological Sciences, General | Associate's degree | 962 | 9.8% | 55 | 2 |
| 4 | 13.1001 | Special Education and Teaching, General | Associate's degree | 896 | 9.1% | 29 | 4 |
| 5 | 13.1210 | Early Childhood Education and Teaching | Associate's degree | 648 | 6.6% | 36 | 4 |
| 6 | 51.1501 | Substance Abuse/Addiction Counseling | Associate's degree | 540 | 5.5% | 13 | 1 |
| 7 | 13.0101 | Education, General | Bachelor's degree | 534 | 5.4% | 21 | 1 |
| 8 | 44.0701 | Social Work | Associate's degree | 513 | 5.2% | 39 | 2 |
| 9 | 23.0101 | English Language and Literature, General | Associate's degree | 462 | 4.7% | 52 | 2 |
| 10 | 45.1001 | Political Science and Government, General | Associate's degree | 461 | 4.7% | 45 | 2 |
| 1 Adjusted graduates reflect stay-in-state rate × CIP-SOC crosswalk weight; summed across SOCs within cluster. | |||||||
Energy & Natural Resources
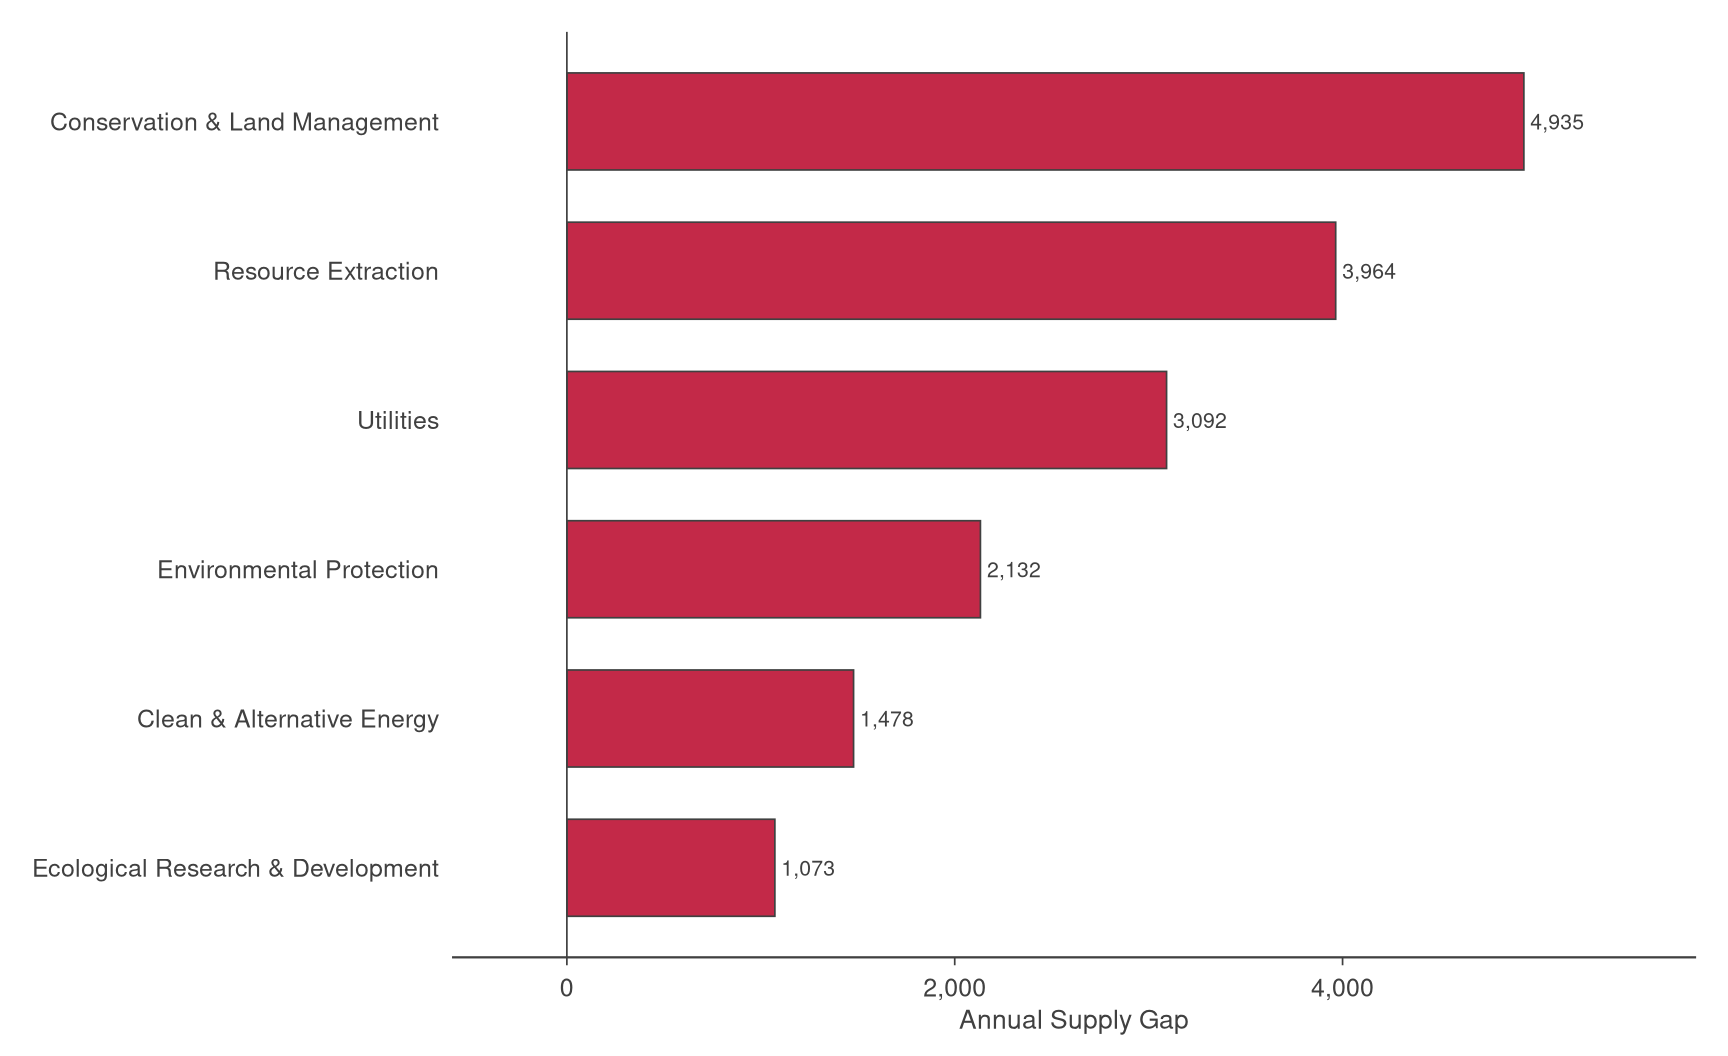
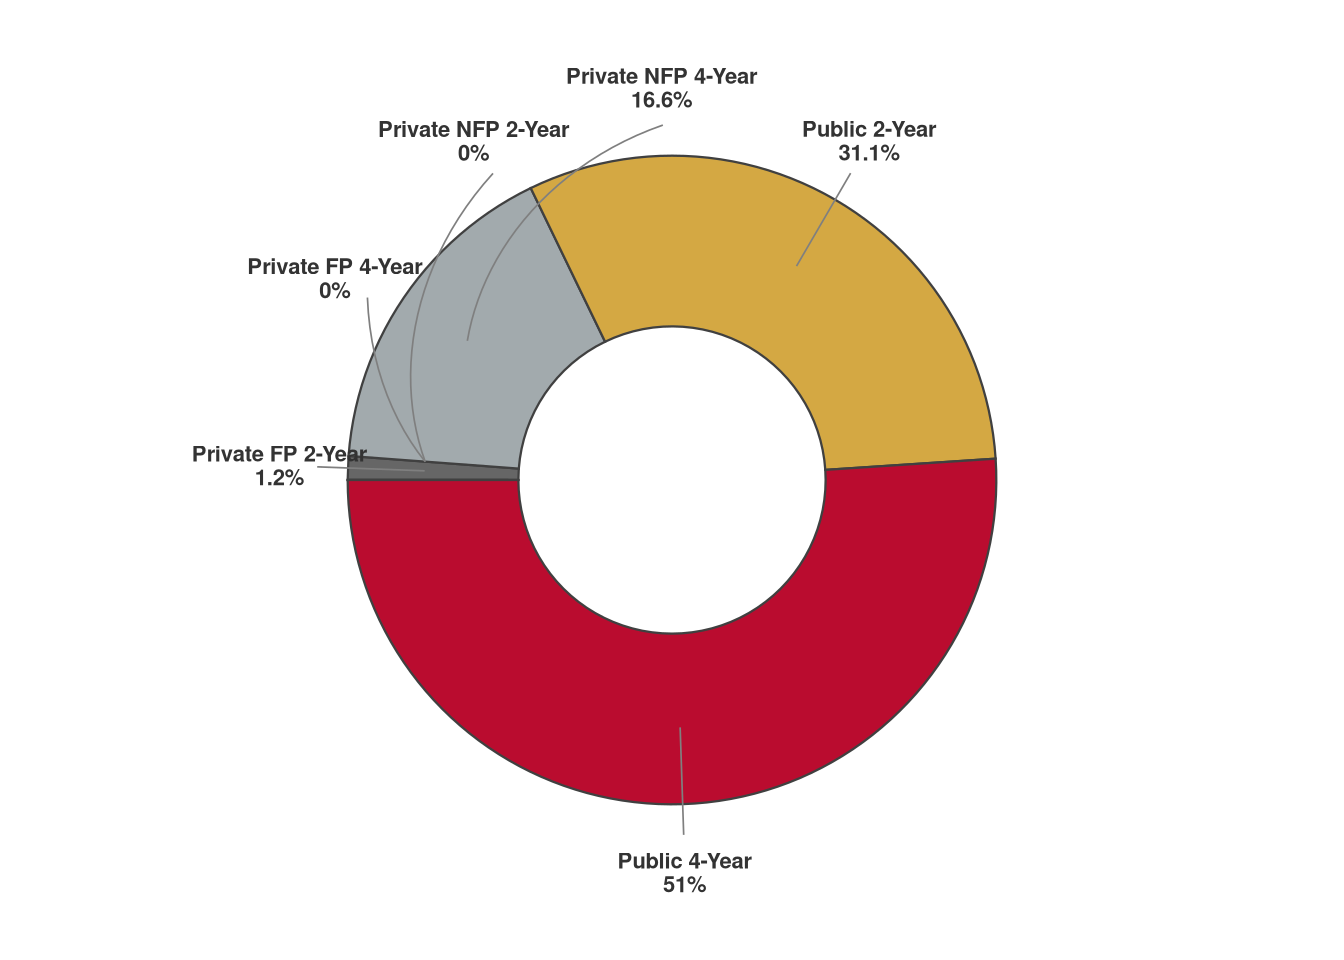
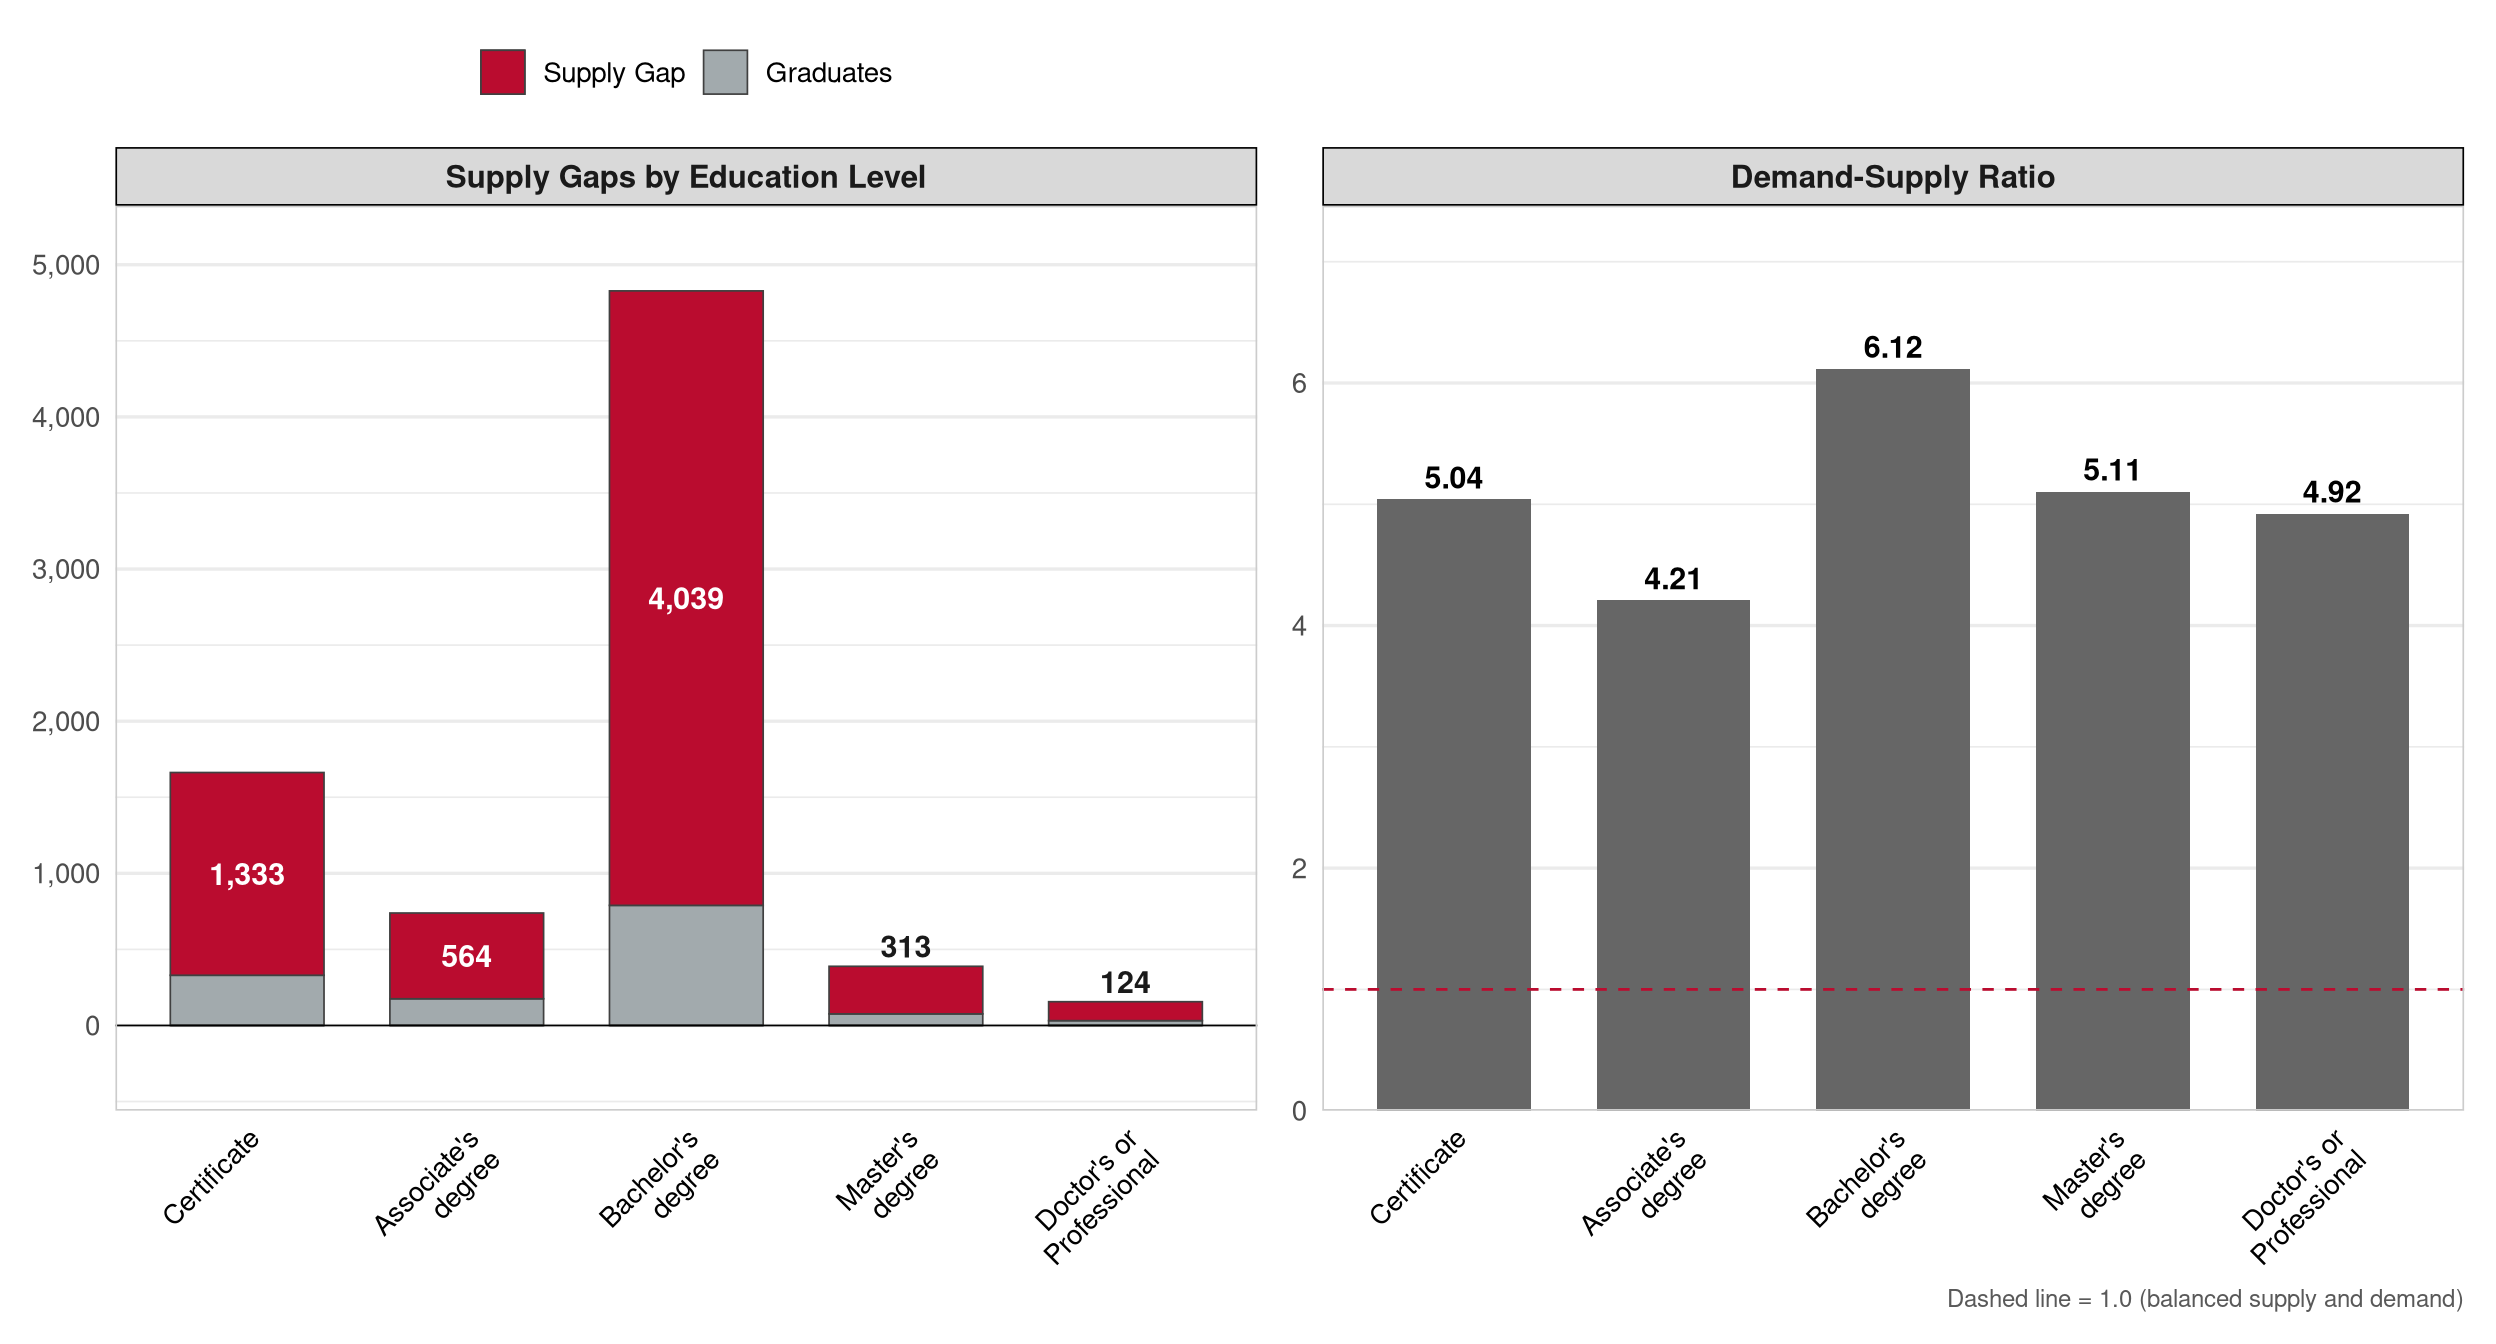
Energy & Natural Resources includes clean and alternative energy, energy infrastructure, environmental services, mining and extraction, natural resources management, and utilities. Like Agriculture, this cluster has a low conversion rate; postsecondary programs account for a limited share of total occupational openings, and the demand-supply ratio is therefore less interpretable as a severity measure than the absolute gap. The gap that does exist is concentrated in infrastructure and environmental services roles, occupations where credential-based pathways are growing in relevance as the sector transitions toward clean energy and updated utility infrastructure.
| Metric | Value |
|---|---|
| Sub-Clusters | Clean & Alternative Energy; Conservation & Land Management; Ecological Research & Development; Environmental Protection; Resource Extraction; Utilities |
| Adj. Graduates | 925 |
| Conversion Rate | 7.5% |
| Annual Supply Gap | 6,850 |
| Proj. Annual Growth | 270 |
| Total Employment | 253,457 |
| Total Earnings | $25.6B |
| Avg Earnings/Worker | $101,200 |
| D-S Ratio | 8.411 |
| 1 D-S ratio = annual demand ÷ adjusted graduate supply. This cluster has a conversion rate below 10%, indicating very limited higher-education pathways relative to total openings. The supply gap is the more reliable comparator. | |
| Institution | Type | Total Grads (Raw) | Stay-in-State Rate | Adj. Graduates | % of Cluster Supply |
|---|---|---|---|---|---|
| Ohio State University-Main Campus | Public 4-Year | 2,600 | 40.0% | 252 | 30.2% |
| Columbus State Community College | Public 2-Year | 352 | 86.8% | 140 | 16.7% |
| University of Cincinnati-Main Campus | Public 4-Year | 1,040 | 47.3% | 137 | 16.5% |
| Stark State College | Public 2-Year | 132 | 68.4% | 54 | 6.4% |
| Ohio University-Main Campus | Public 4-Year | 626 | 33.2% | 50 | 5.9% |
| University of Akron Main Campus | Public 4-Year | 298 | 52.7% | 47 | 5.6% |
| Owens Community College | Public 2-Year | 93 | 72.8% | 42 | 5.0% |
| Hocking College | Public 2-Year | 96 | 54.0% | 39 | 4.7% |
| University of Dayton | Private NFP 4-Year | 333 | 42.5% | 37 | 4.5% |
| Cincinnati State Technical and Community College | Public 2-Year | 72 | 63.5% | 37 | 4.4% |
| # | CIP Code | Program | Primary Level | Adj. Graduates1 | % of Cluster Supply | # Institutions | # SOCs Served |
|---|---|---|---|---|---|---|---|
| 1 | 40.0601 | Geology/Earth Science, General | Associate's degree | 143 | 17.6% | 20 | 4 |
| 2 | 15.1102 | Surveying Technology/Surveying | Associate's degree | 123 | 15.1% | 5 | 2 |
| 3 | 14.1001 | Electrical and Electronics Engineering | Bachelor's degree | 96 | 11.9% | 16 | 1 |
| 4 | 46.0503 | Plumbing Technology/Plumber | Associate's degree | 96 | 11.8% | 3 | 2 |
| 5 | 15.0612 | Industrial Technology/Technician | Associate's degree | 88 | 10.9% | 8 | 1 |
| 6 | 26.0202 | Biochemistry | Associate's degree | 64 | 7.9% | 27 | 1 |
| 7 | 15.0201 | Civil Engineering Technologies/Technicians | Associate's degree | 53 | 6.5% | 9 | 1 |
| 8 | 03.0104 | Environmental Science | Associate's degree | 50 | 6.2% | 28 | 3 |
| 9 | 26.9999 | Biological and Biomedical Sciences, Other | Associate's degree | 49 | 6.0% | 4 | 1 |
| 10 | 14.1401 | Environmental/Environmental Health Engineering | Associate's degree | 49 | 6.0% | 7 | 2 |
| 1 Adjusted graduates reflect stay-in-state rate × CIP-SOC crosswalk weight; summed across SOCs within cluster. | |||||||
Financial Services
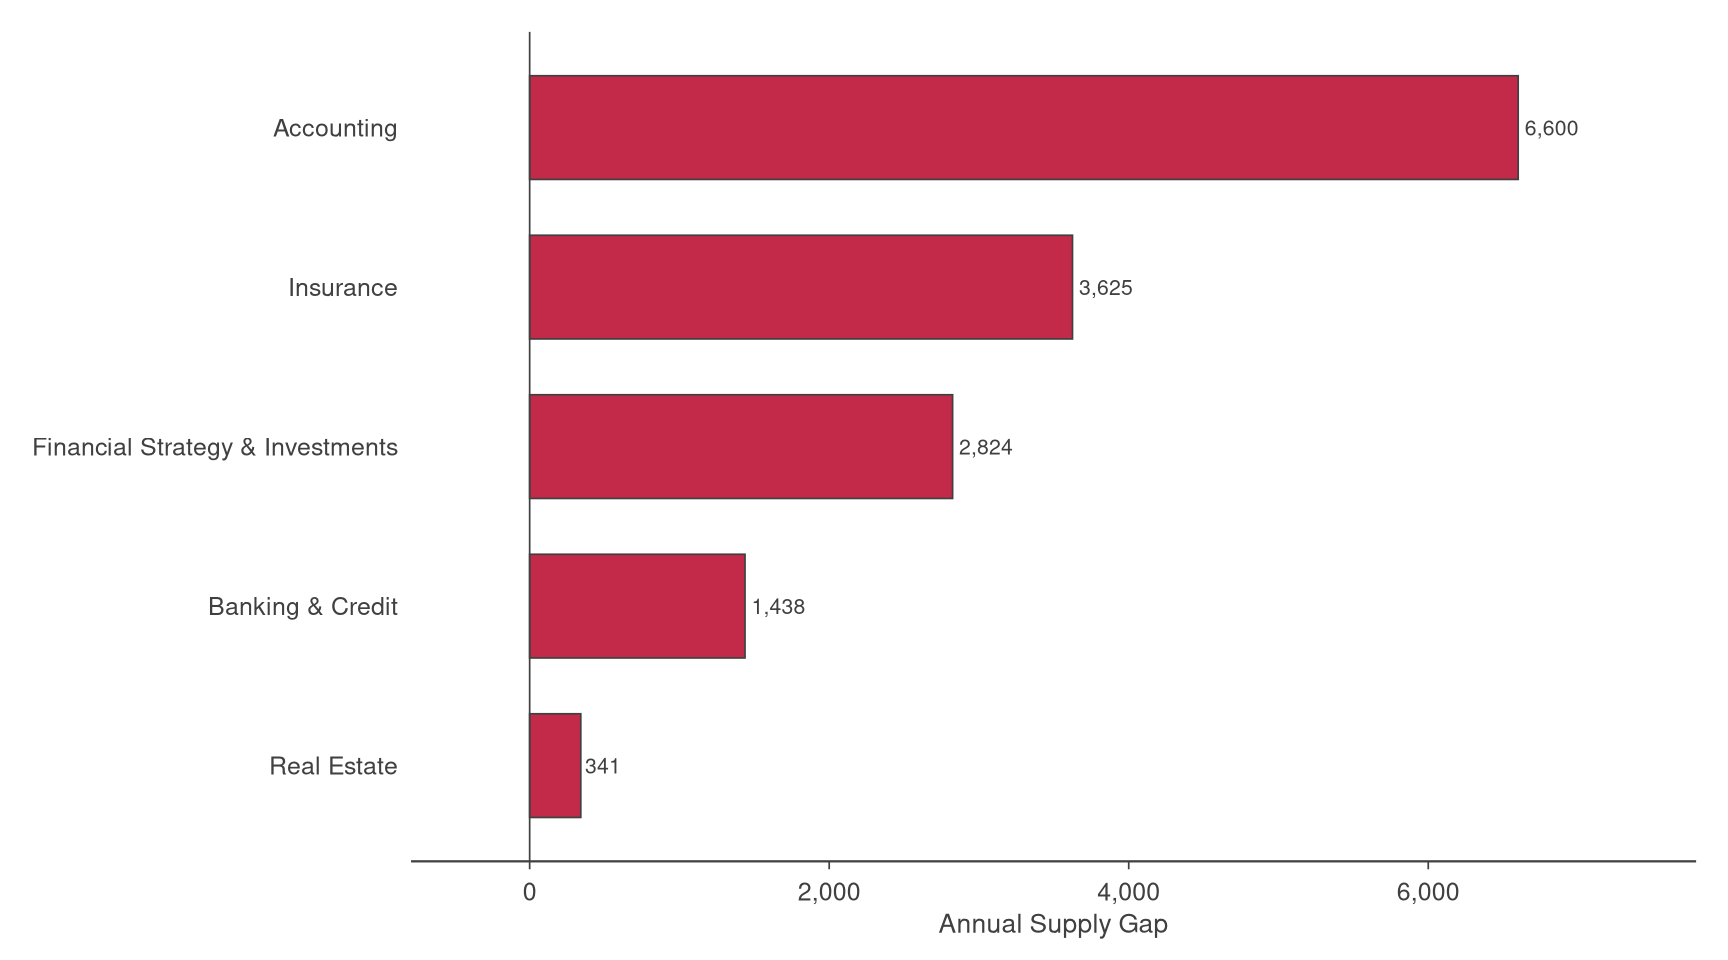
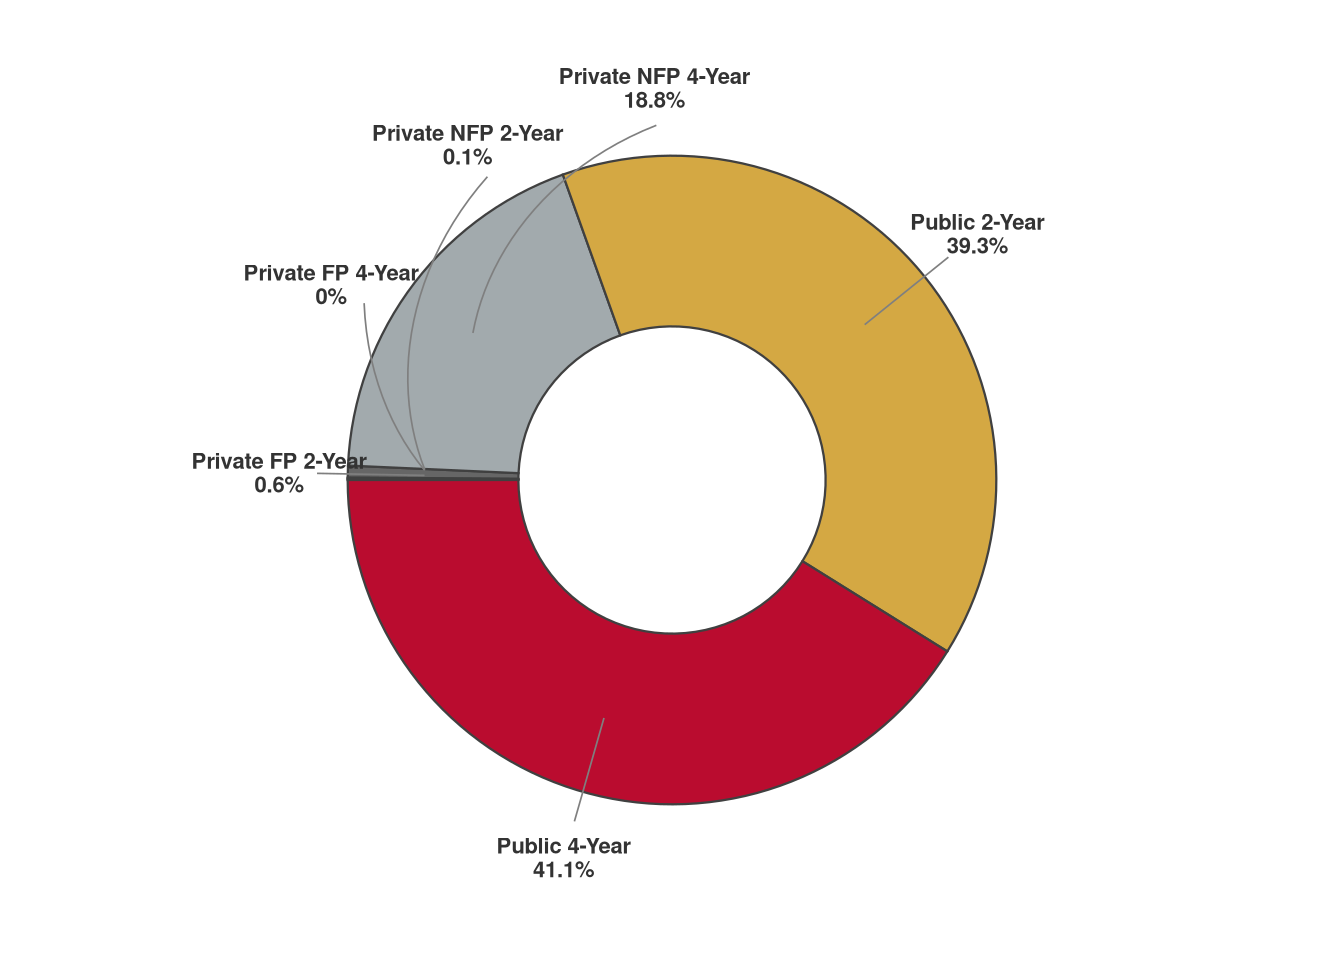
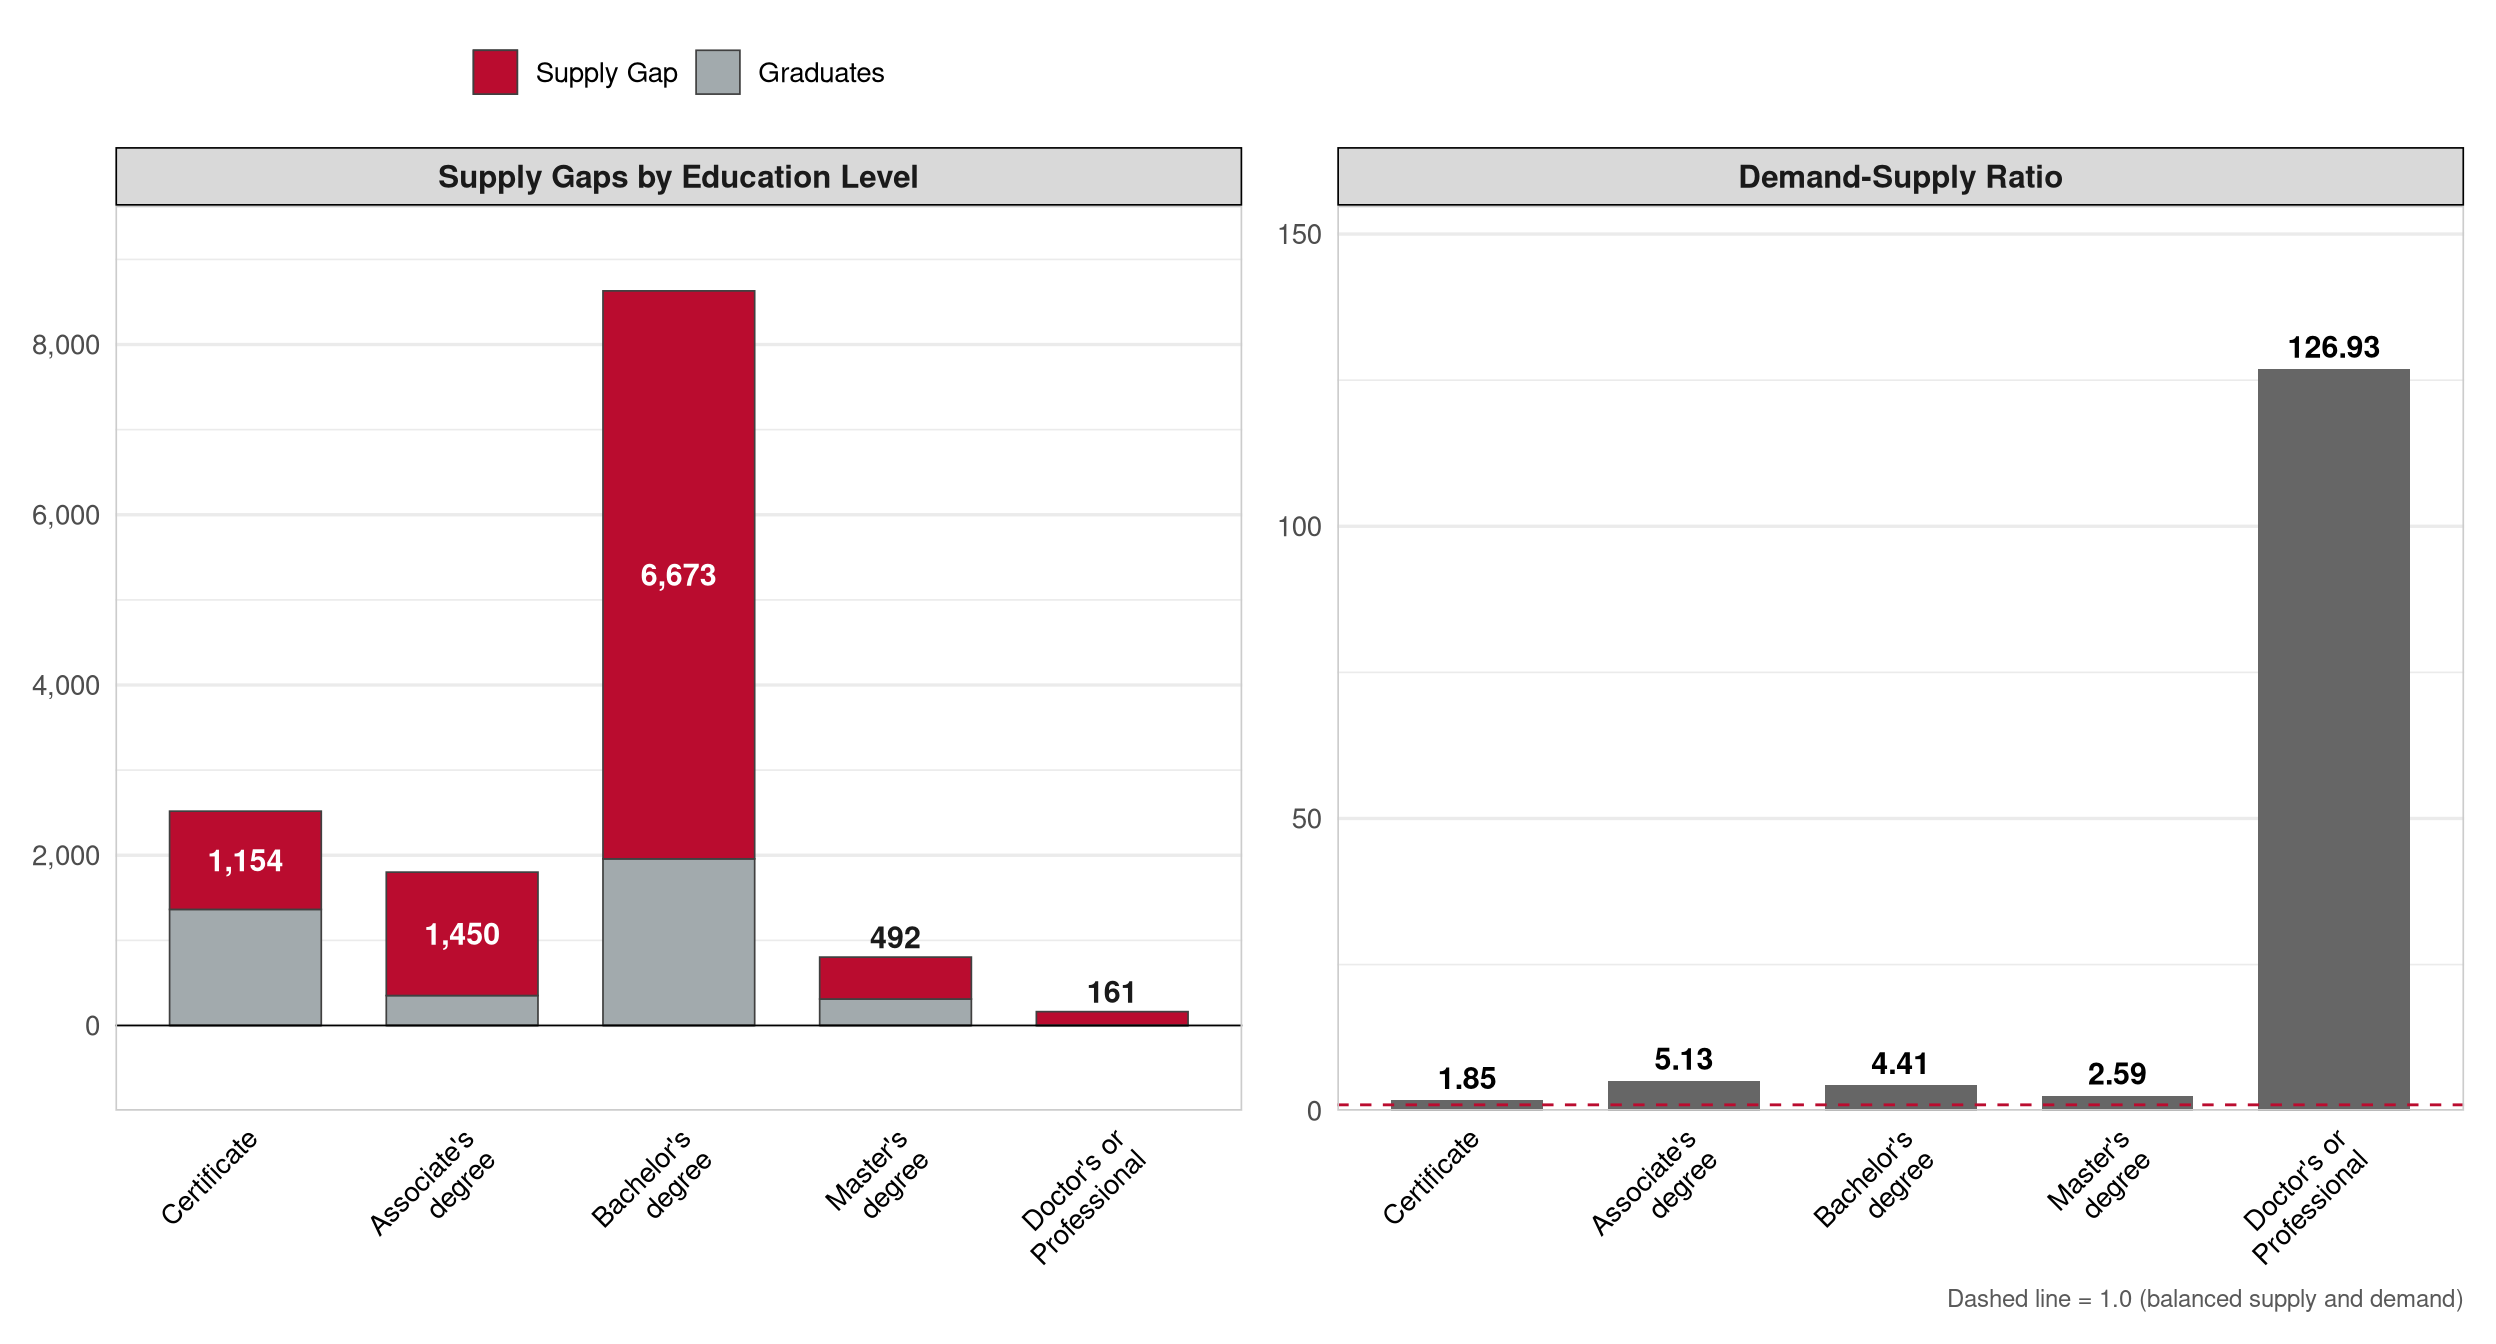
Financial Services covers accounting, banking and credit, financial planning, insurance, and investment services. Demand concentrates at the bachelor’s level, reflecting the credential expectations of the sector’s core professional roles, with secondary demand at the associate and certificate levels in insurance operations and banking services. Ohio’s large financial services sector generates stable replacement demand alongside moderate projected growth. Total earnings in this cluster ($21.3B) reflect a relatively high wage profile relative to the number of openings, making gap-filling in this cluster economically meaningful on a per-position basis.
| Metric | Value |
|---|---|
| Sub-Clusters | Accounting; Banking & Credit; Financial Strategy & Investments; Insurance; Real Estate |
| Adj. Graduates | 3,979 |
| Conversion Rate | 7.7% |
| Annual Supply Gap | 9,936 |
| Proj. Annual Growth | 576 |
| Total Employment | 302,132 |
| Total Earnings | $21.3B |
| Avg Earnings/Worker | $70,500 |
| D-S Ratio | 3.501 |
| 1 D-S ratio = annual demand ÷ adjusted graduate supply. This cluster has a conversion rate below 10%, indicating very limited higher-education pathways relative to total openings. The supply gap is the more reliable comparator. | |
| Institution | Type | Total Grads (Raw) | Stay-in-State Rate | Adj. Graduates | % of Cluster Supply |
|---|---|---|---|---|---|
| Ohio State University-Main Campus | Public 4-Year | 2,569 | 48.4% | 441 | 20.8% |
| University of Cincinnati-Main Campus | Public 4-Year | 1,357 | 64.3% | 292 | 13.8% |
| Lorain County Community College | Public 2-Year | 470 | 63.9% | 281 | 13.3% |
| Columbus State Community College | Public 2-Year | 456 | 66.4% | 263 | 12.4% |
| Stark State College | Public 2-Year | 279 | 63.8% | 174 | 8.2% |
| Miami University-Oxford | Public 4-Year | 1,233 | 37.7% | 165 | 7.8% |
| Sinclair Community College | Public 2-Year | 572 | 28.7% | 152 | 7.2% |
| Franklin University | Private NFP 4-Year | 797 | 58.5% | 121 | 5.7% |
| Kent State University at Kent | Public 4-Year | 968 | 60.8% | 117 | 5.5% |
| Cleveland State University | Public 4-Year | 464 | 74.7% | 115 | 5.4% |
| # | CIP Code | Program | Primary Level | Adj. Graduates1 | % of Cluster Supply | # Institutions | # SOCs Served |
|---|---|---|---|---|---|---|---|
| 1 | 52.0301 | Accounting | Associate's degree | 1,496 | 40.5% | 47 | 5 |
| 2 | 52.1501 | Real Estate | Associate's degree | 855 | 23.1% | 14 | 3 |
| 3 | 52.0801 | Finance, General | Associate's degree | 600 | 16.2% | 35 | 7 |
| 4 | 52.0302 | Accounting Technology/Technician and Bookkeeping | Associate's degree | 352 | 9.5% | 20 | 3 |
| 5 | 52.1601 | Taxation | Associate's degree | 101 | 2.7% | 2 | 3 |
| 6 | 52.1001 | Human Resources Management/Personnel Administration, General | Associate's degree | 90 | 2.4% | 22 | 2 |
| 7 | 19.0401 | Family Resource Management Studies, General | Bachelor's degree | 71 | 1.9% | 1 | 1 |
| 8 | 22.0302 | Legal Assistant/Paralegal | Associate's degree | 47 | 1.3% | 15 | 1 |
| 9 | 52.1701 | Insurance | Associate's degree | 43 | 1.2% | 6 | 5 |
| 10 | 27.0305 | Financial Mathematics | Bachelor's degree | 42 | 1.1% | 4 | 3 |
| 1 Adjusted graduates reflect stay-in-state rate × CIP-SOC crosswalk weight; summed across SOCs within cluster. | |||||||
Healthcare & Human Services
Healthcare & Human Services encompasses behavioral and mental health, community and social services, diagnostic services, health informatics, nursing and patient care, and therapeutic services. This cluster carries one of the largest absolute supply gaps in the state, with a gap of 16,325 and the fastest projected annual employment growth among all 14 clusters (2,876 net new positions). The Physical Health and Behavioral & Mental Health Sub-Clusters drive most of the unmet demand. The gap spans all credential levels, reflecting Ohio’s broad healthcare workforce challenges, but associate-level programs are a particularly critical supply channel given the occupational composition of the nursing and allied health pipeline.
| Metric | Value |
|---|---|
| Sub-Clusters | Behavioral & Mental Health; Biotechnology Research & Development; Community & Social Services; Health Data & Administration; Personal Care Services; Physical Health |
| Adj. Graduates | 23,415 |
| Conversion Rate | 21.8% |
| Annual Supply Gap | 16,325 |
| Proj. Annual Growth | 2,876 |
| Total Employment | 677,342 |
| Total Earnings | $50.9B |
| Avg Earnings/Worker | $75,100 |
| D-S Ratio | 1.70 |


| Institution | Type | Total Grads (Raw) | Stay-in-State Rate | Adj. Graduates | % of Cluster Supply |
|---|---|---|---|---|---|
| Ohio University-Main Campus | Public 4-Year | 3,918 | 61.7% | 1,665 | 17.5% |
| Ohio State University-Main Campus | Public 4-Year | 5,788 | 57.5% | 1,538 | 16.2% |
| University of Cincinnati-Main Campus | Public 4-Year | 4,171 | 50.1% | 1,071 | 11.3% |
| Columbus State Community College | Public 2-Year | 1,572 | 68.0% | 929 | 9.8% |
| Hondros College of Nursing | Private FP 2-Year | 1,287 | 68.7% | 884 | 9.3% |
| Cuyahoga Community College District | Public 2-Year | 1,181 | 74.6% | 801 | 8.4% |
| Kent State University at Kent | Public 4-Year | 2,391 | 61.6% | 774 | 8.2% |
| Sinclair Community College | Public 2-Year | 1,988 | 51.7% | 756 | 8.0% |
| Case Western Reserve University | Private NFP 4-Year | 1,832 | 55.1% | 539 | 5.7% |
| University of Toledo | Public 4-Year | 1,760 | 50.3% | 537 | 5.7% |
| # | CIP Code | Program | Primary Level | Adj. Graduates1 | % of Cluster Supply | # Institutions | # SOCs Served |
|---|---|---|---|---|---|---|---|
| 1 | 51.3801 | Registered Nursing/Registered Nurse | Associate's degree | 7,379 | 49.4% | 56 | 1 |
| 2 | 44.0701 | Social Work | Associate's degree | 1,572 | 10.5% | 39 | 7 |
| 3 | 51.3901 | Licensed Practical/Vocational Nurse Training | Associate's degree | 1,384 | 9.3% | 33 | 1 |
| 4 | 51.3902 | Nursing Assistant/Aide and Patient Care Assistant/Aide | Certificate | 1,176 | 7.9% | 11 | 1 |
| 5 | 51.0904 | Emergency Medical Technology/Technician (EMT Paramedic) | Associate's degree | 738 | 4.9% | 17 | 2 |
| 6 | 51.0701 | Health/Health Care Administration/Management | Associate's degree | 656 | 4.4% | 21 | 1 |
| 7 | 51.1201 | Medicine | Doctor's or Professional | 526 | 3.5% | 6 | 15 |
| 8 | 51.0713 | Medical Insurance Coding Specialist/Coder | Associate's degree | 524 | 3.5% | 22 | 2 |
| 9 | 12.0409 | Aesthetician/Esthetician and Skin Care Specialist | Certificate | 518 | 3.5% | 13 | 1 |
| 10 | 51.0801 | Medical/Clinical Assistant | Associate's degree | 460 | 3.1% | 40 | 1 |
| 1 Adjusted graduates reflect stay-in-state rate × CIP-SOC crosswalk weight; summed across SOCs within cluster. | |||||||
Hospitality, Events, & Tourism
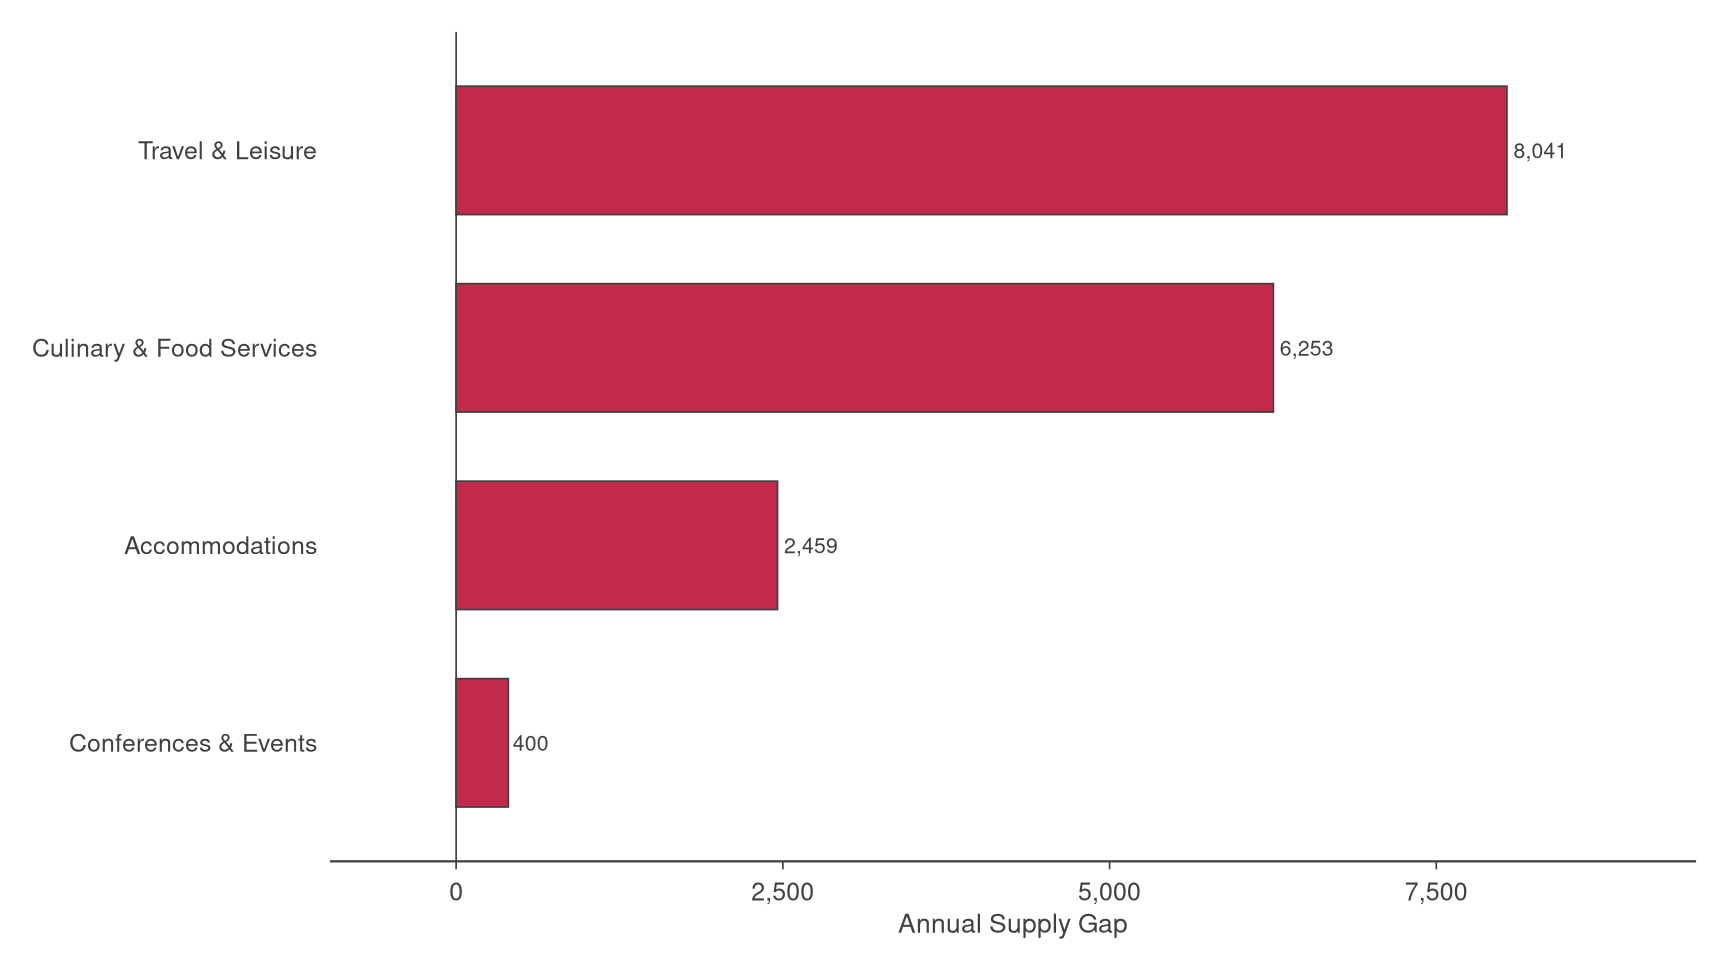
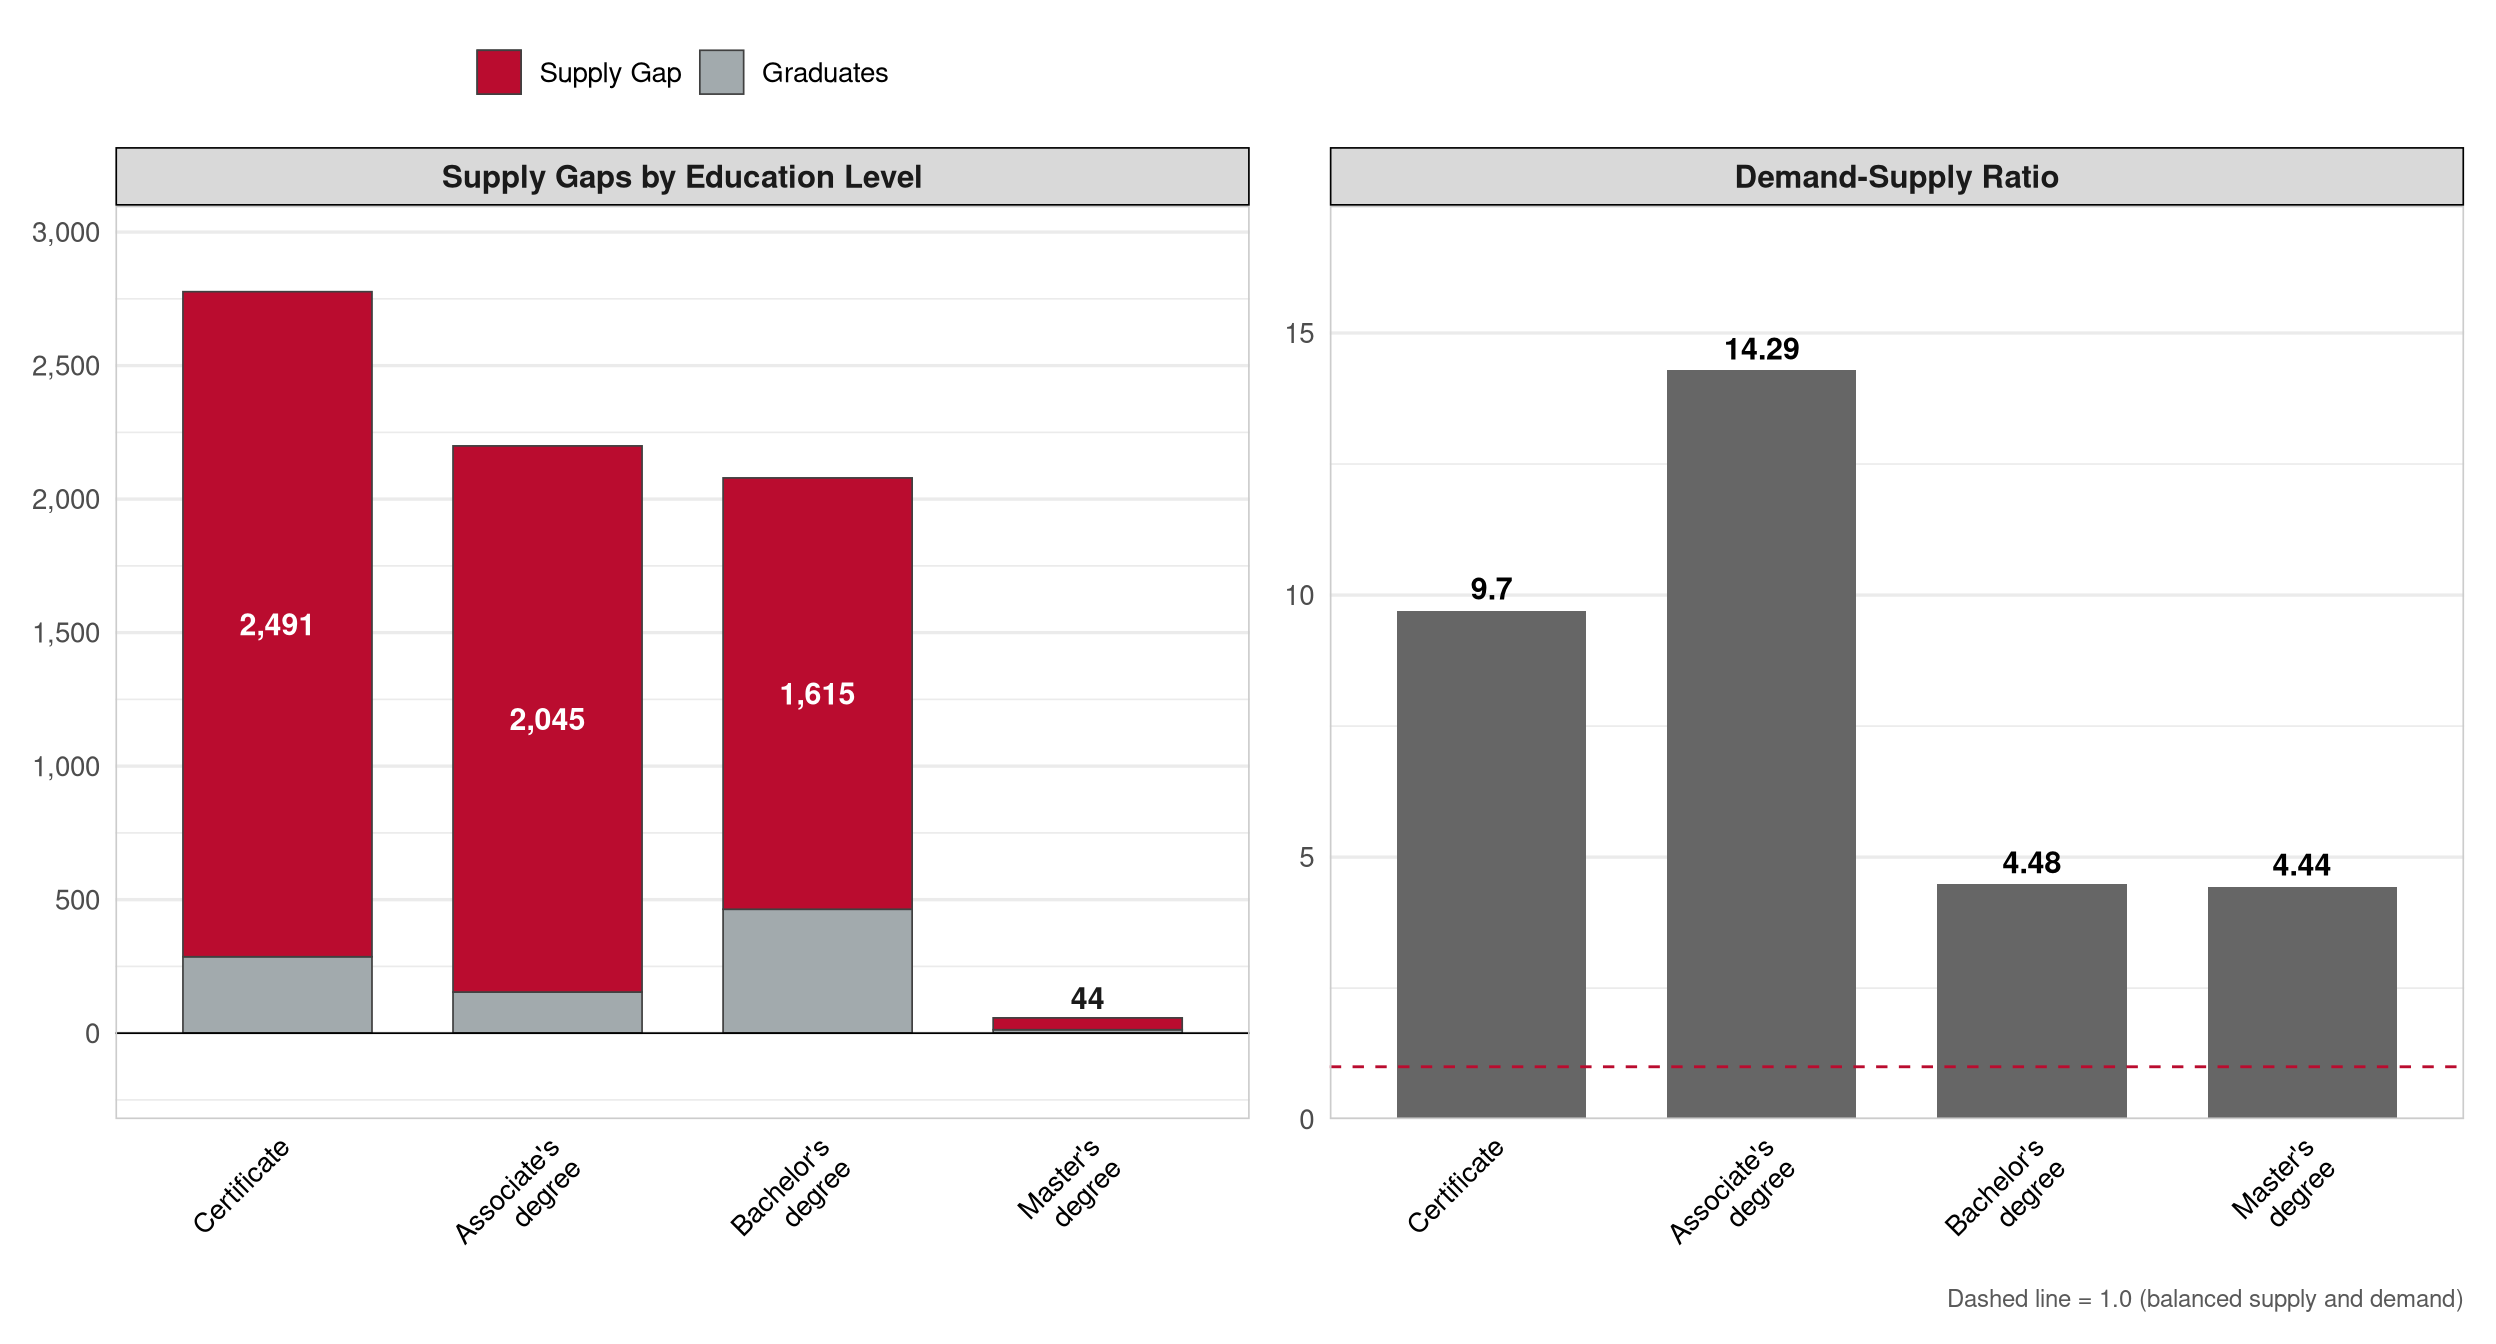
Hospitality, Events, & Tourism includes accommodations, conferences and events, culinary and food services, and recreation and tourism. This cluster has among the lowest conversion rates of all 14 clusters: most occupational openings fall outside typical higher education pathways, filled instead through on-the-job training and experience-based progression. The portion of demand that is postsecondary aligned is nonetheless real, concentrated in culinary management, events coordination, and hospitality administration roles. As with other low-conversion clusters, the demand-supply ratio is less informative than the absolute gap for gauging where program investment would have the greatest impact.
| Metric | Value |
|---|---|
| Sub-Clusters | Accommodations; Conferences & Events; Culinary & Food Services; Travel & Leisure |
| Adj. Graduates | 852 |
| Conversion Rate | 5.0% |
| Annual Supply Gap | 6,260 |
| Proj. Annual Growth | 191 |
| Total Employment | 218,795 |
| Total Earnings | $9.3B |
| Avg Earnings/Worker | $42,600 |
| D-S Ratio | 8.341 |
| 1 D-S ratio = annual demand ÷ adjusted graduate supply. This cluster has a conversion rate below 10%, indicating very limited higher-education pathways relative to total openings. The supply gap is the more reliable comparator. | |
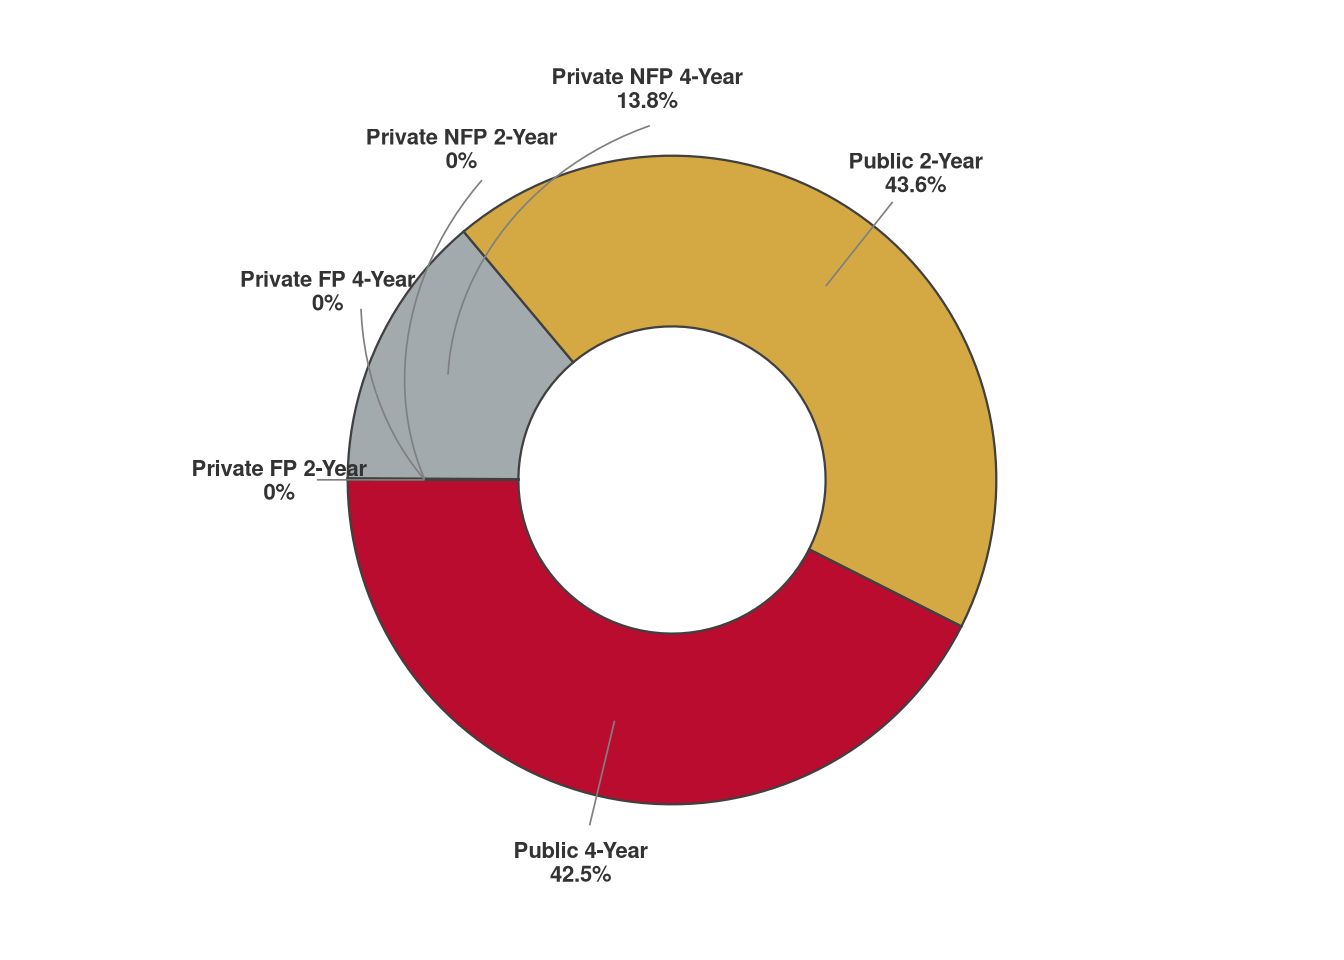
| Institution | Type | Total Grads (Raw) | Stay-in-State Rate | Adj. Graduates | % of Cluster Supply |
|---|---|---|---|---|---|
| Sinclair Community College | Public 2-Year | 705 | 37.0% | 131 | 20.7% |
| Cuyahoga Community College District | Public 2-Year | 254 | 62.6% | 104 | 16.3% |
| Cincinnati State Technical and Community College | Public 2-Year | 245 | 55.4% | 83 | 13.1% |
| Kent State University at Kent | Public 4-Year | 868 | 60.2% | 72 | 11.4% |
| University of Cincinnati-Main Campus | Public 4-Year | 1,097 | 62.7% | 63 | 10.0% |
| Ohio State University-Main Campus | Public 4-Year | 921 | 51.0% | 43 | 6.7% |
| Miami University-Oxford | Public 4-Year | 652 | 36.2% | 41 | 6.5% |
| Ohio University-Main Campus | Public 4-Year | 725 | 53.8% | 39 | 6.1% |
| Columbus State Community College | Public 2-Year | 176 | 64.8% | 37 | 5.8% |
| University of Akron Main Campus | Public 4-Year | 281 | 70.3% | 21 | 3.3% |
| # | CIP Code | Program | Primary Level | Adj. Graduates1 | % of Cluster Supply | # Institutions | # SOCs Served |
|---|---|---|---|---|---|---|---|
| 1 | 52.1401 | Marketing/Marketing Management, General | Associate's degree | 252 | 31.7% | 43 | 2 |
| 2 | 52.0901 | Hospitality Administration/Management, General | Associate's degree | 145 | 18.3% | 6 | 3 |
| 3 | 12.0503 | Culinary Arts/Chef Training | Associate's degree | 139 | 17.4% | 10 | 3 |
| 4 | 09.0100 | Communication, General | Associate's degree | 55 | 6.9% | 15 | 2 |
| 5 | 12.0501 | Baking and Pastry Arts/Baker/Pastry Chef | Associate's degree | 49 | 6.1% | 5 | 2 |
| 6 | 09.0902 | Public Relations/Image Management | Associate's degree | 45 | 5.6% | 15 | 2 |
| 7 | 01.0605 | Landscaping and Groundskeeping | Associate's degree | 42 | 5.3% | 4 | 2 |
| 8 | 09.0909 | Communication Management and Strategic Communications | Bachelor's degree | 28 | 3.5% | 5 | 1 |
| 9 | 52.0905 | Restaurant/Food Services Management | Associate's degree | 22 | 2.7% | 4 | 2 |
| 10 | 31.0504 | Sport and Fitness Administration/Management | Associate's degree | 20 | 2.5% | 43 | 1 |
| 1 Adjusted graduates reflect stay-in-state rate × CIP-SOC crosswalk weight; summed across SOCs within cluster. | |||||||
Management & Entrepreneurship
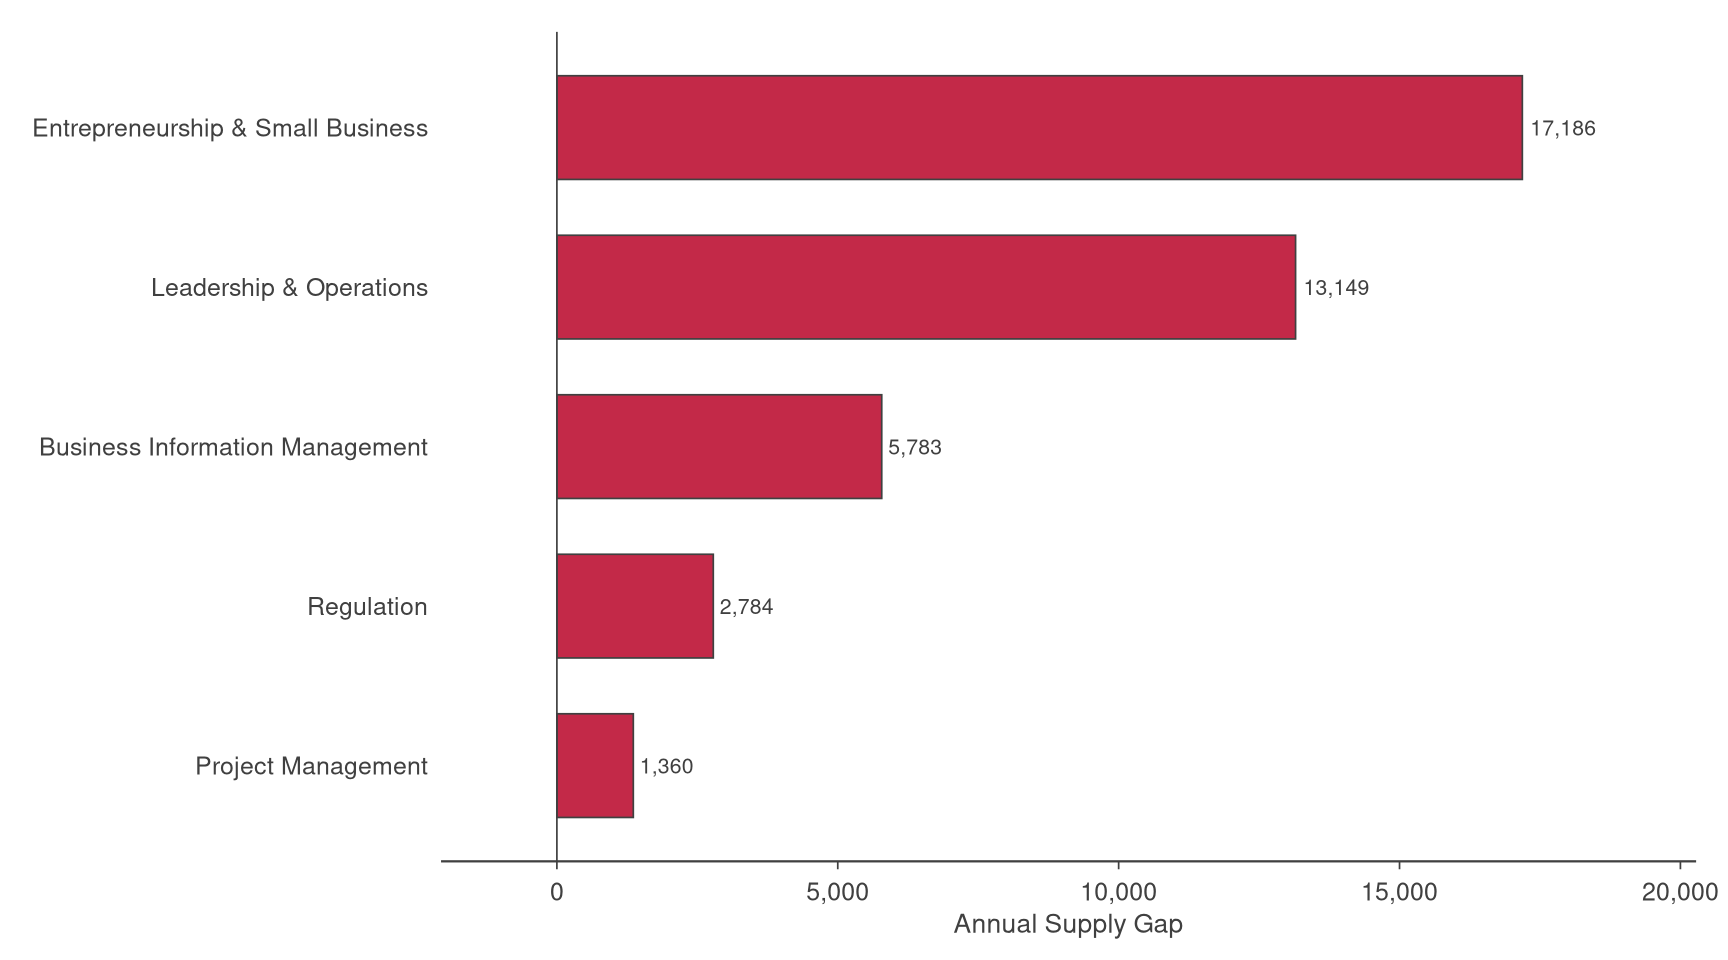
Management & Entrepreneurship covers business information management, entrepreneurship, human resources, operations management, and project management. Demand spans degree levels; bachelor’s programs dominate supply, but sub-baccalaureate credentials in operations and human resources represent an underdeveloped pipeline relative to employer demand. The combination of scale, earnings weight, and cross-sector relevance makes Management & Entrepreneurship a high-priority cluster for both program expansion and transfer pathway development.
| Metric | Value |
|---|---|
| Sub-Clusters | Business Information Management; Entrepreneurship & Small Business; Leadership & Operations; Project Management; Regulation |
| Adj. Graduates | 15,319 |
| Conversion Rate | 9.1% |
| Annual Supply Gap | 13,380 |
| Proj. Annual Growth | 644 |
| Total Employment | 664,563 |
| Total Earnings | $57.1B |
| Avg Earnings/Worker | $85,900 |
| D-S Ratio | 1.871 |
| 1 D-S ratio = annual demand ÷ adjusted graduate supply. This cluster has a conversion rate below 10%, indicating very limited higher-education pathways relative to total openings. The supply gap is the more reliable comparator. | |
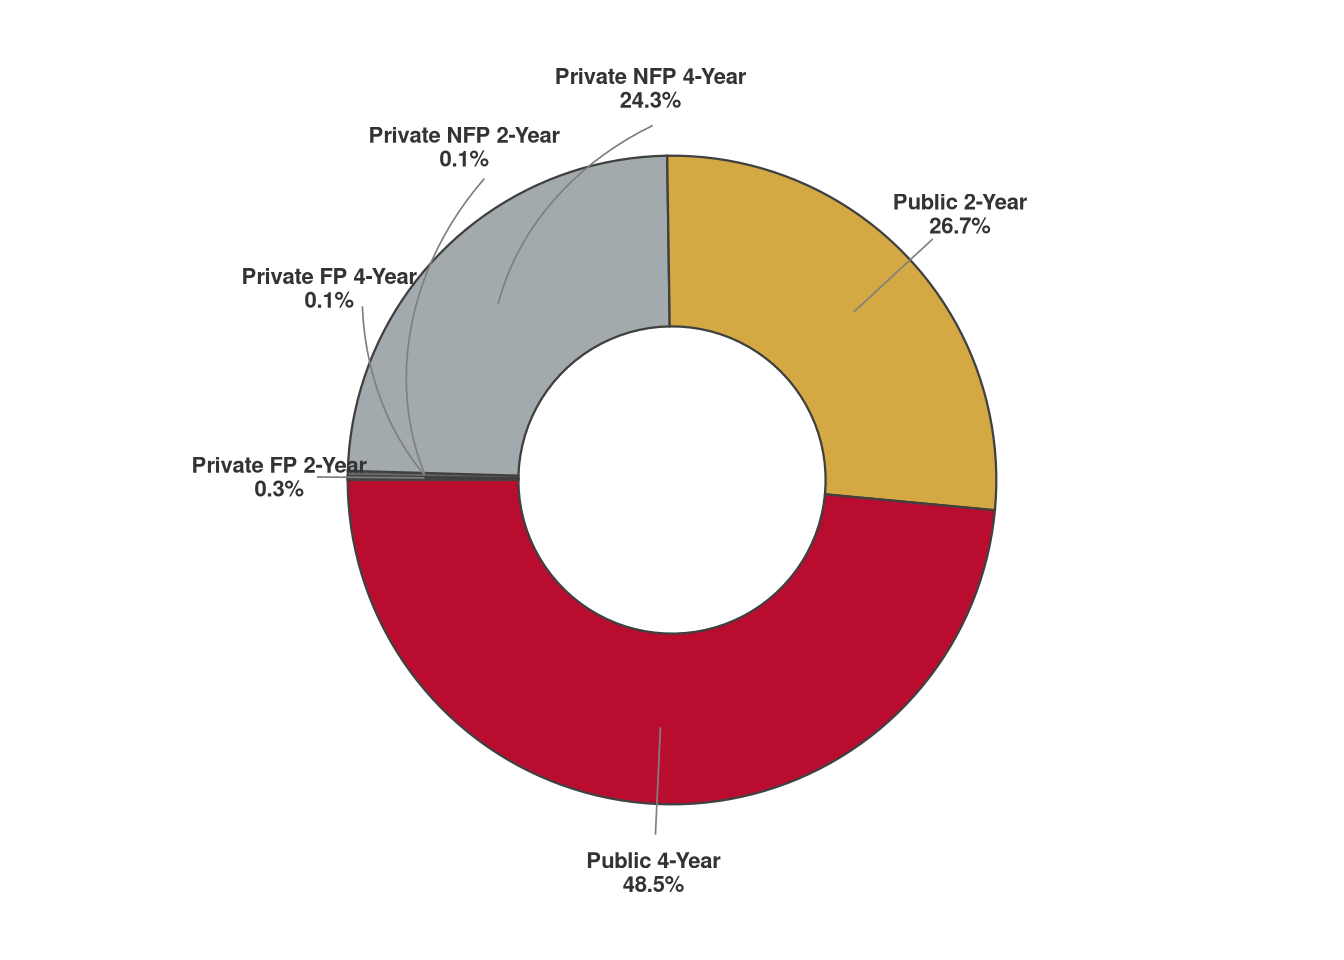
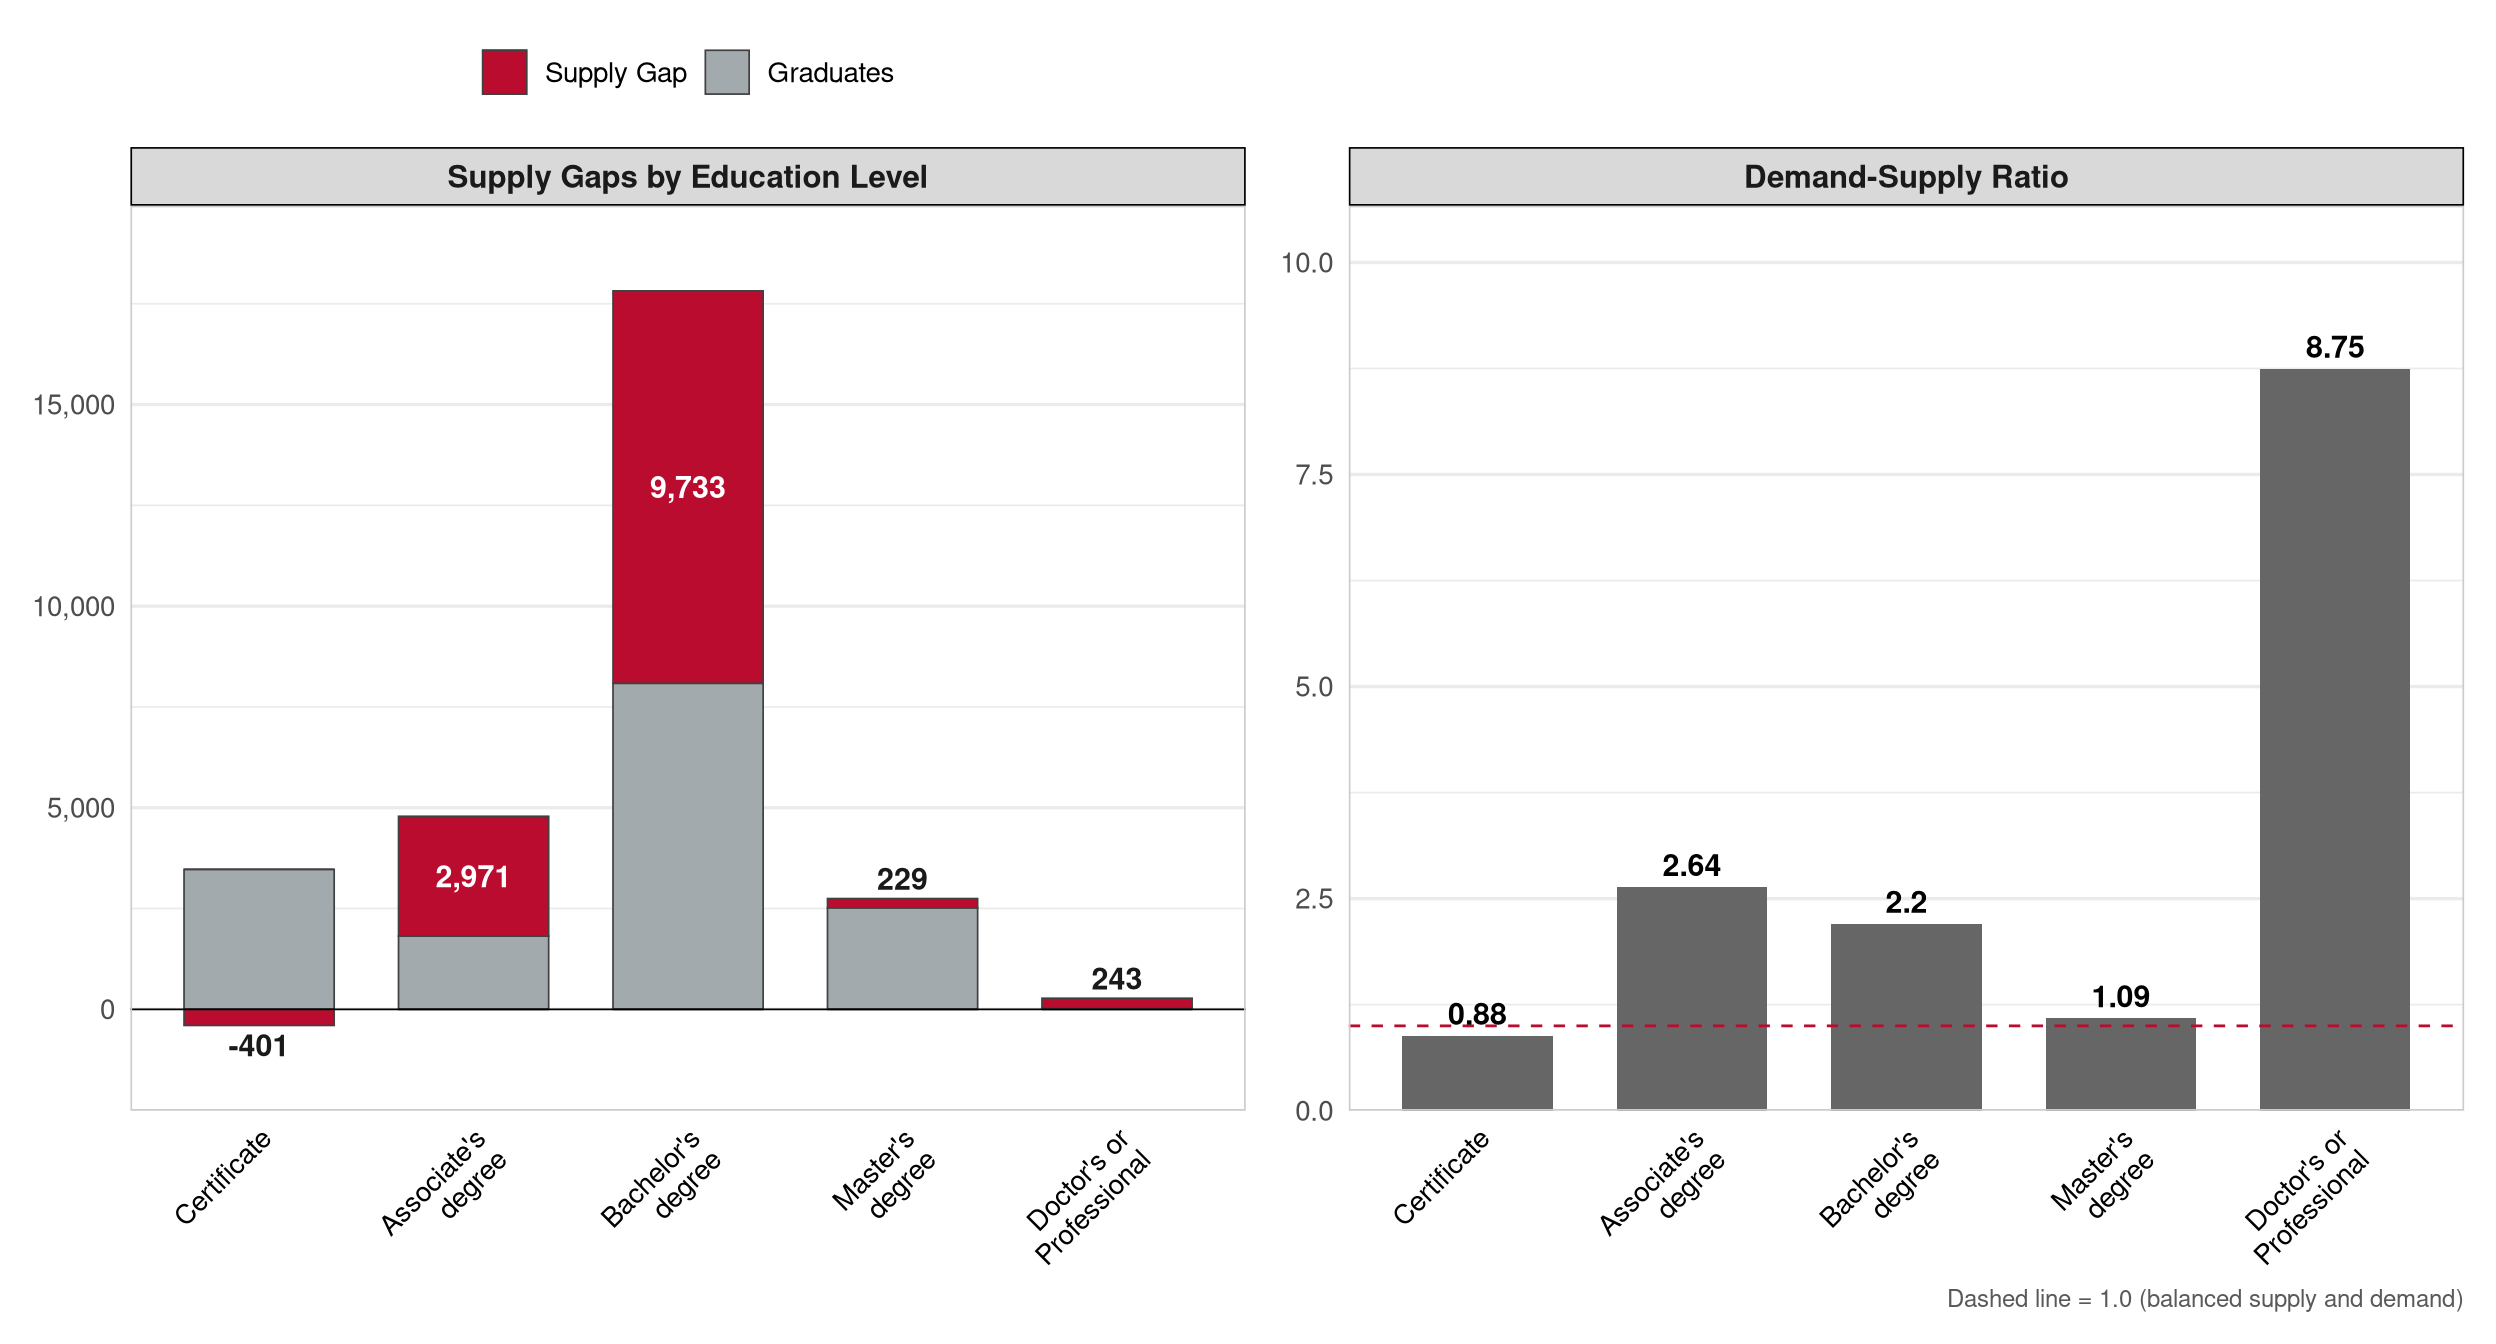
| Institution | Type | Total Grads (Raw) | Stay-in-State Rate | Adj. Graduates | % of Cluster Supply |
|---|---|---|---|---|---|
| Sinclair Community College | Public 2-Year | 8,224 | 31.7% | 2,225 | 24.4% |
| Ohio State University-Main Campus | Public 4-Year | 4,974 | 52.2% | 1,748 | 19.2% |
| University of Cincinnati-Main Campus | Public 4-Year | 2,797 | 61.2% | 1,059 | 11.6% |
| Ohio University-Main Campus | Public 4-Year | 2,552 | 53.0% | 936 | 10.3% |
| Kent State University at Kent | Public 4-Year | 1,775 | 58.4% | 675 | 7.4% |
| Franklin University | Private NFP 4-Year | 1,441 | 57.8% | 615 | 6.7% |
| Cleveland State University | Public 4-Year | 1,175 | 72.1% | 610 | 6.7% |
| Miami University-Oxford | Public 4-Year | 2,043 | 39.7% | 430 | 4.7% |
| Eastern Gateway Community College | Public 2-Year | 2,492 | 19.3% | 424 | 4.7% |
| Youngstown State University | Public 4-Year | 835 | 62.8% | 392 | 4.3% |
| # | CIP Code | Program | Primary Level | Adj. Graduates1 | % of Cluster Supply | # Institutions | # SOCs Served |
|---|---|---|---|---|---|---|---|
| 1 | 52.0201 | Business Administration and Management, General | Associate's degree | 7,497 | 49.8% | 55 | 13 |
| 2 | 52.0411 | Customer Service Support/Call Center/Teleservice Operation | Certificate | 1,713 | 11.4% | 4 | 1 |
| 3 | 42.0101 | Psychology, General | Associate's degree | 1,620 | 10.8% | 60 | 2 |
| 4 | 52.0801 | Finance, General | Associate's degree | 1,084 | 7.2% | 35 | 3 |
| 5 | 52.0101 | Business/Commerce, General | Associate's degree | 850 | 5.6% | 23 | 7 |
| 6 | 52.0701 | Entrepreneurship/Entrepreneurial Studies | Associate's degree | 585 | 3.9% | 16 | 3 |
| 7 | 09.0101 | Speech Communication and Rhetoric | Associate's degree | 574 | 3.8% | 29 | 2 |
| 8 | 52.1001 | Human Resources Management/Personnel Administration, General | Associate's degree | 401 | 2.7% | 22 | 7 |
| 9 | 52.0213 | Organizational Leadership | Bachelor's degree | 397 | 2.6% | 15 | 4 |
| 10 | 42.2704 | Experimental Psychology | Bachelor's degree | 346 | 2.3% | 5 | 1 |
| 1 Adjusted graduates reflect stay-in-state rate × CIP-SOC crosswalk weight; summed across SOCs within cluster. | |||||||
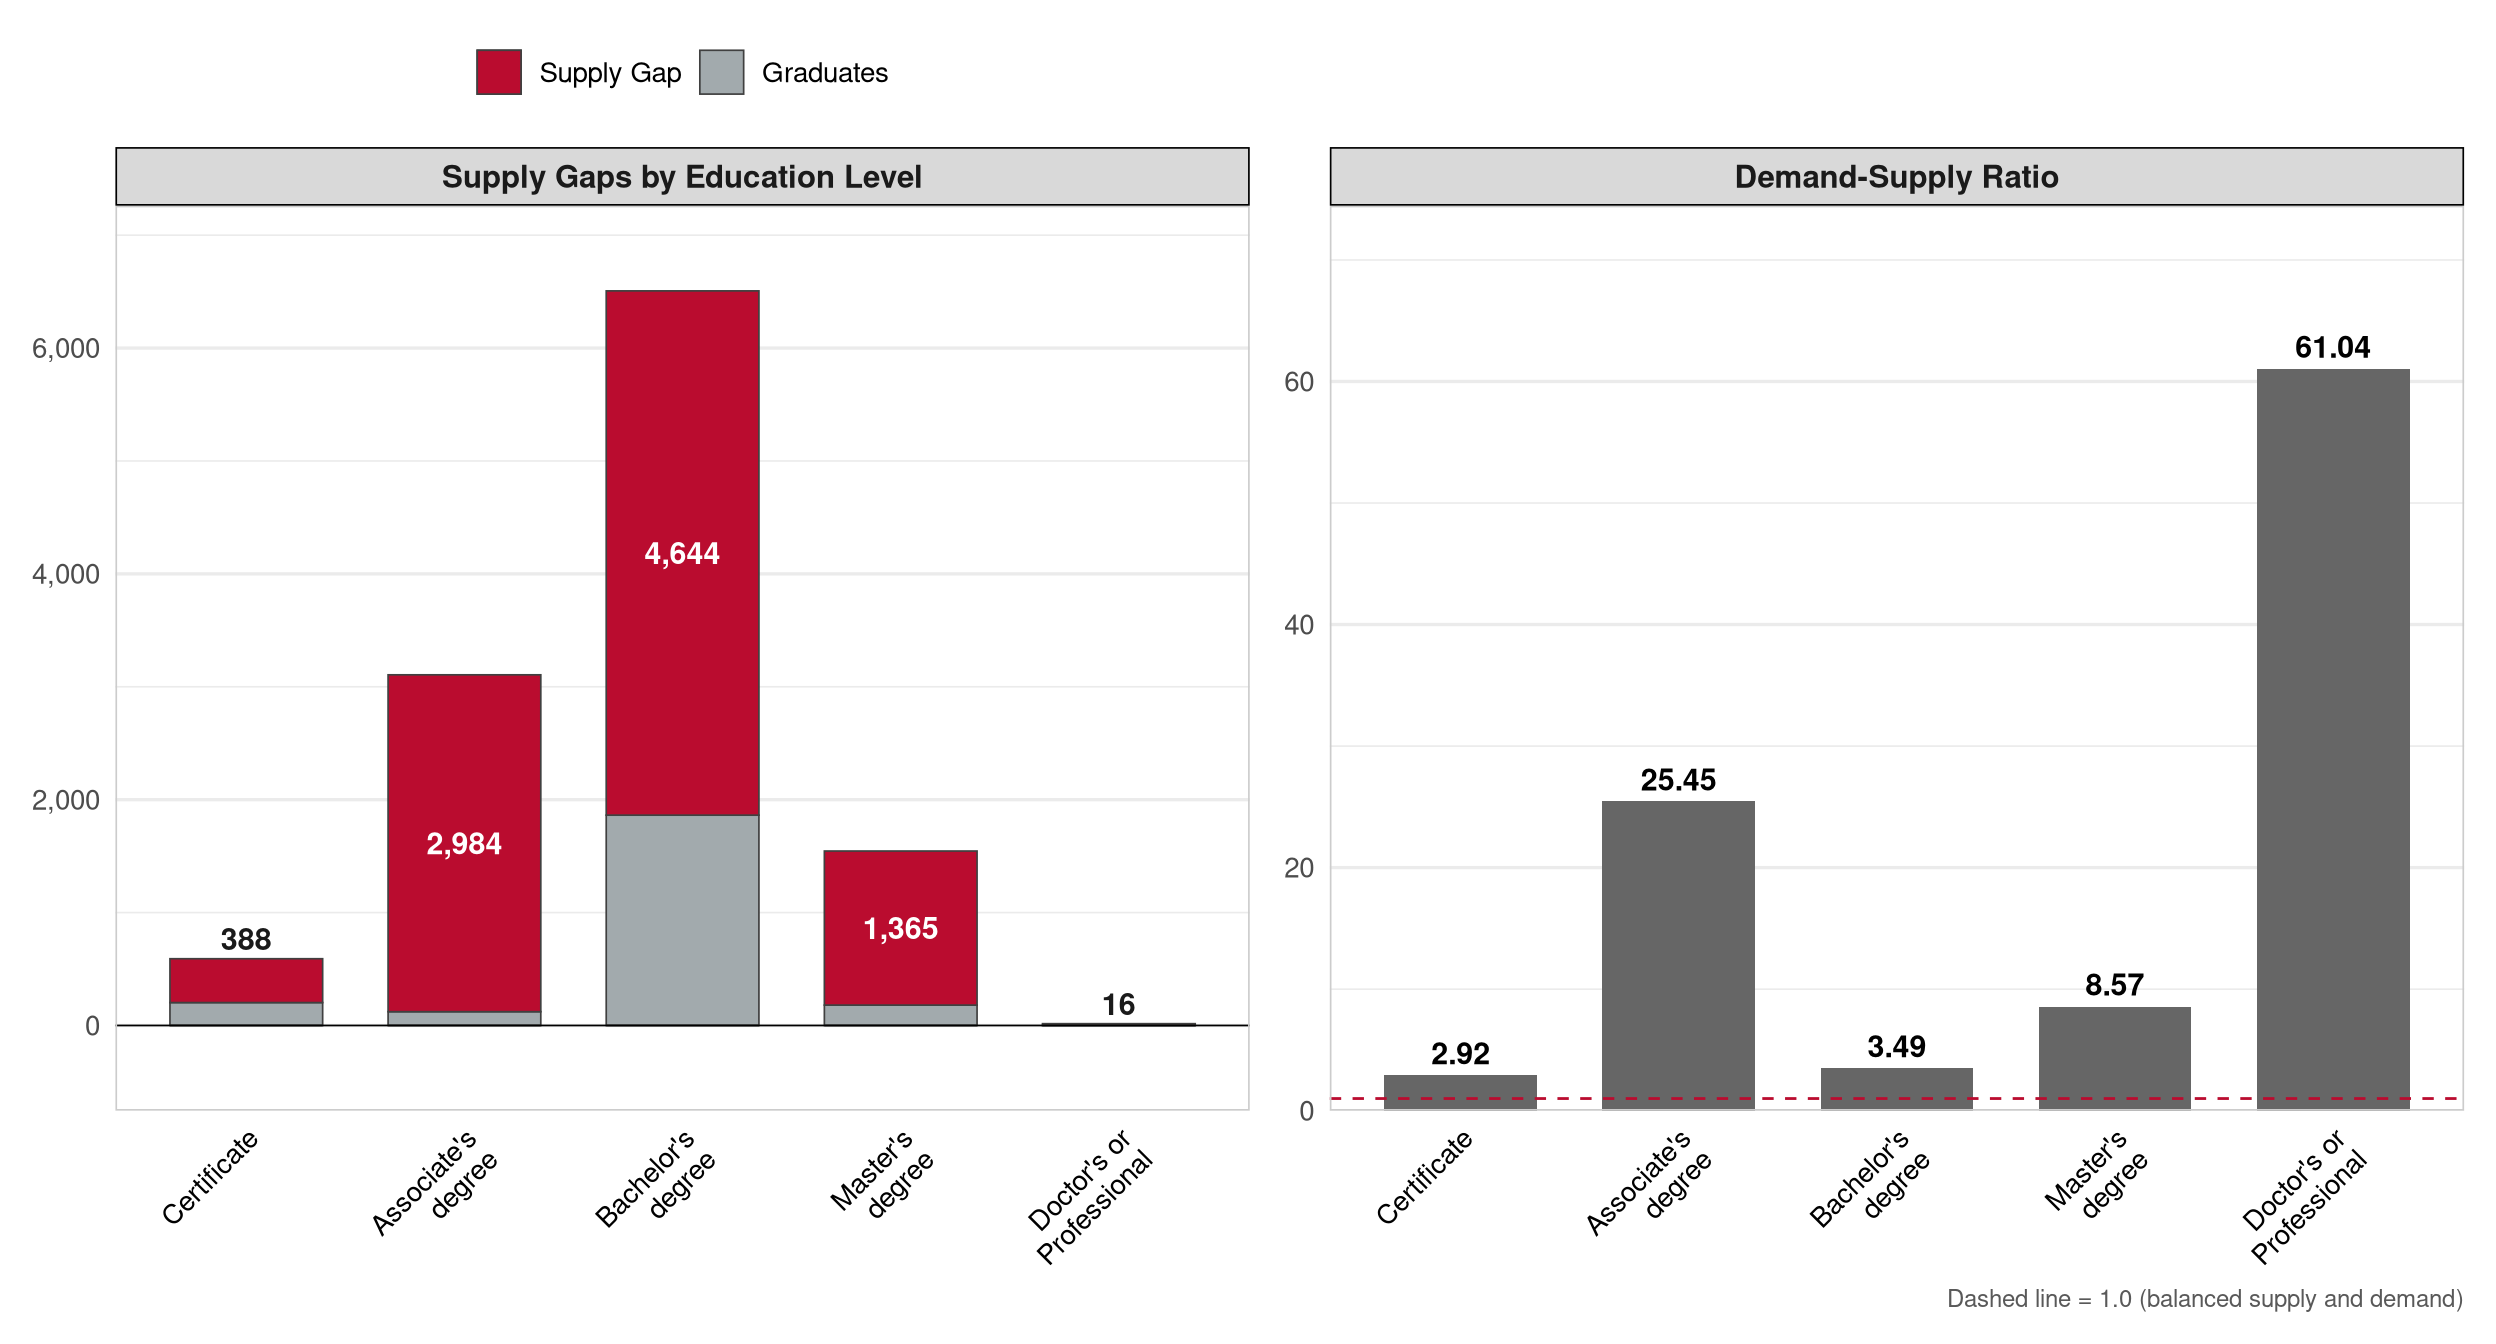
Marketing & Sales
Marketing & Sales includes e-commerce and digital marketing, market research and analytics, merchandising, and professional sales. Demand is concentrated at the bachelor’s level, though digital marketing and e-commerce roles increasingly draw candidates from shorter-term credentials and non-traditional pathways. Graduate supply from private institutions is relatively high compared to other clusters, reflecting the prominence of business programs at both private nonprofit and for-profit institutions. The market research and analytics Sub-Cluster, while smaller in volume, reflects growing employer demand for data-literate marketing professionals and may represent a targeted opportunity for applied analytics programs.
| Metric | Value |
|---|---|
| Sub-Clusters | Market Research, Analytics, & Ethics; Marketing & Advertising; Retail & Customer Experience; Strategic Sales |
| Adj. Graduates | 2,357 |
| Conversion Rate | 9.7% |
| Annual Supply Gap | 9,407 |
| Proj. Annual Growth | 320 |
| Total Employment | 319,146 |
| Total Earnings | $21.6B |
| Avg Earnings/Worker | $67,700 |
| D-S Ratio | 4.991 |
| 1 D-S ratio = annual demand ÷ adjusted graduate supply. This cluster has a conversion rate below 10%, indicating very limited higher-education pathways relative to total openings. The supply gap is the more reliable comparator. | |
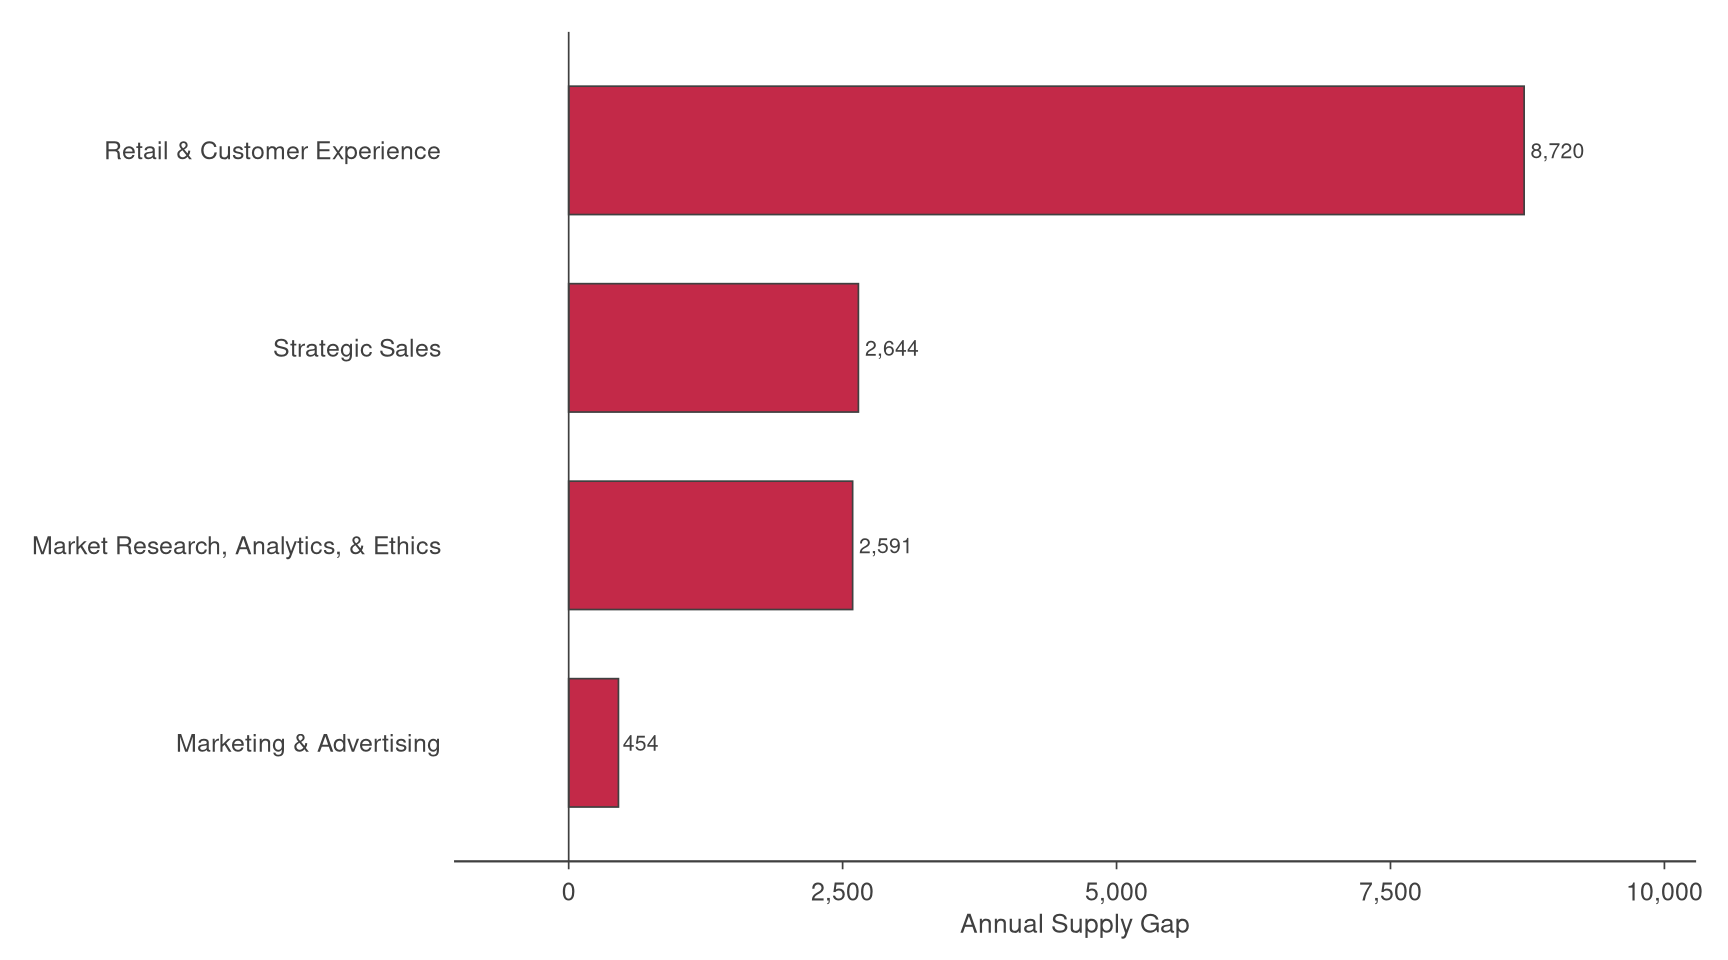
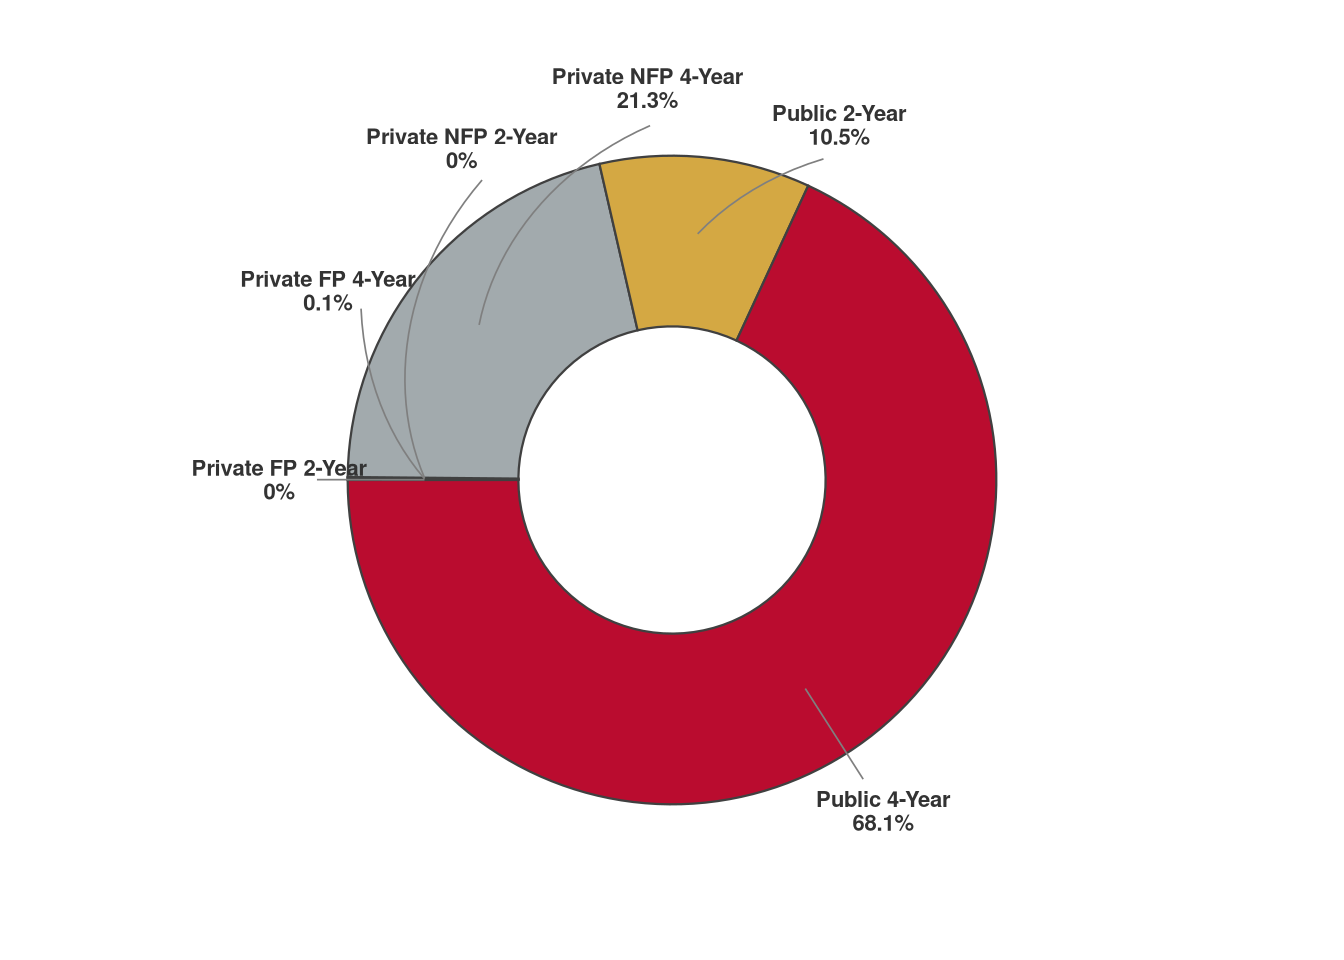
| Institution | Type | Total Grads (Raw) | Stay-in-State Rate | Adj. Graduates | % of Cluster Supply |
|---|---|---|---|---|---|
| University of Cincinnati-Main Campus | Public 4-Year | 914 | 64.6% | 306 | 18.6% |
| Kent State University at Kent | Public 4-Year | 915 | 59.5% | 303 | 18.4% |
| Ohio University-Main Campus | Public 4-Year | 892 | 59.0% | 224 | 13.6% |
| Ohio State University-Main Campus | Public 4-Year | 770 | 49.6% | 203 | 12.3% |
| Columbus State Community College | Public 2-Year | 359 | 56.4% | 140 | 8.5% |
| University of Toledo | Public 4-Year | 406 | 57.0% | 109 | 6.6% |
| Miami University-Oxford | Public 4-Year | 451 | 37.5% | 99 | 6.0% |
| University of Akron Main Campus | Public 4-Year | 228 | 74.2% | 98 | 6.0% |
| University of Dayton | Private NFP 4-Year | 295 | 58.6% | 83 | 5.0% |
| Bowling Green State University-Main Campus | Public 4-Year | 279 | 60.3% | 81 | 4.9% |
| # | CIP Code | Program | Primary Level | Adj. Graduates1 | % of Cluster Supply | # Institutions | # SOCs Served |
|---|---|---|---|---|---|---|---|
| 1 | 52.1401 | Marketing/Marketing Management, General | Associate's degree | 1,535 | 65.9% | 43 | 4 |
| 2 | 52.0201 | Business Administration and Management, General | Associate's degree | 170 | 7.3% | 55 | 1 |
| 3 | 52.1902 | Fashion Merchandising | Associate's degree | 150 | 6.4% | 4 | 1 |
| 4 | 50.0406 | Commercial Photography | Associate's degree | 130 | 5.6% | 3 | 1 |
| 5 | 30.7102 | Business Analytics | Associate's degree | 125 | 5.4% | 6 | 2 |
| 6 | 52.1804 | Selling Skills and Sales Operations | Associate's degree | 76 | 3.3% | 7 | 5 |
| 7 | 52.1801 | Sales, Distribution, and Marketing Operations, General | Associate's degree | 56 | 2.4% | 3 | 1 |
| 8 | 09.0903 | Advertising | Associate's degree | 35 | 1.5% | 4 | 1 |
| 9 | 52.0101 | Business/Commerce, General | Associate's degree | 35 | 1.5% | 23 | 1 |
| 10 | 52.1499 | Marketing, Other | Bachelor's degree | 18 | 0.8% | 5 | 2 |
| 1 Adjusted graduates reflect stay-in-state rate × CIP-SOC crosswalk weight; summed across SOCs within cluster. | |||||||
Public Service & Safety
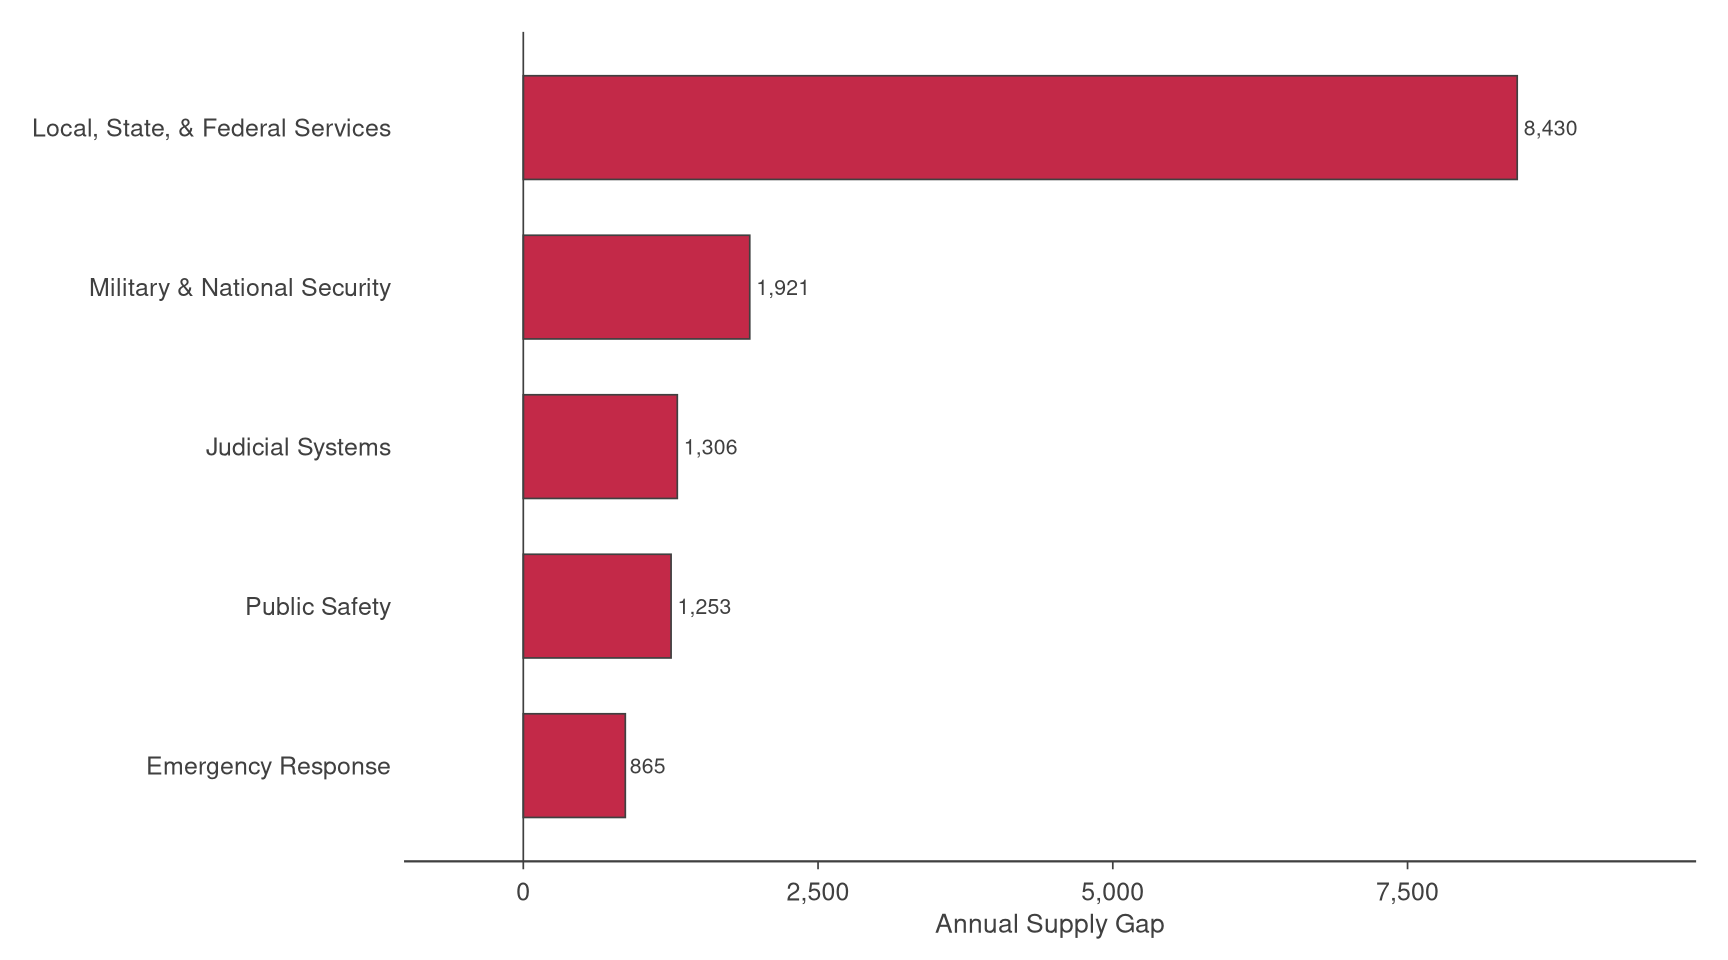
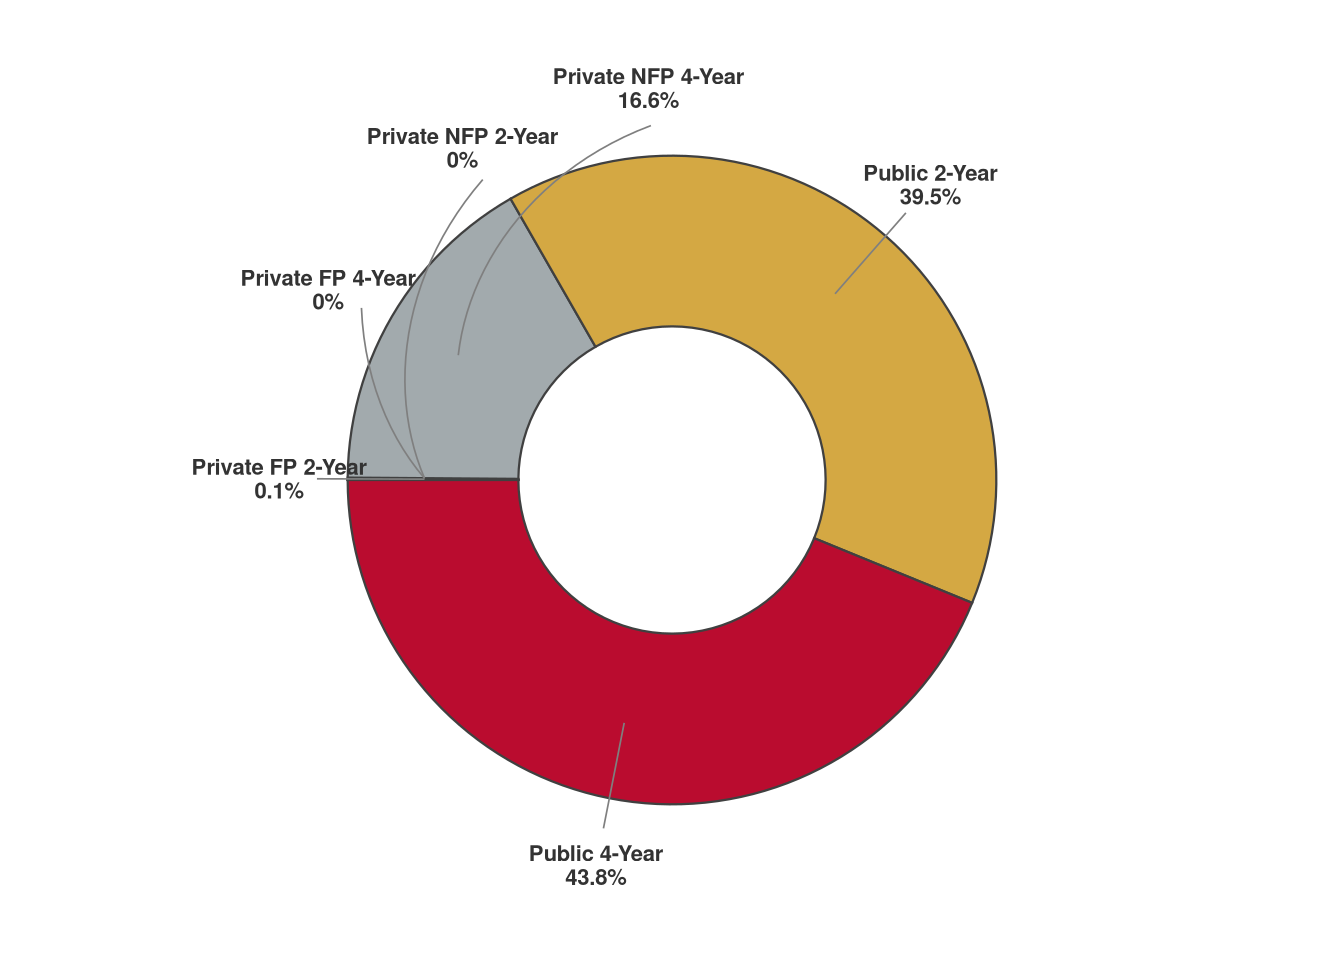
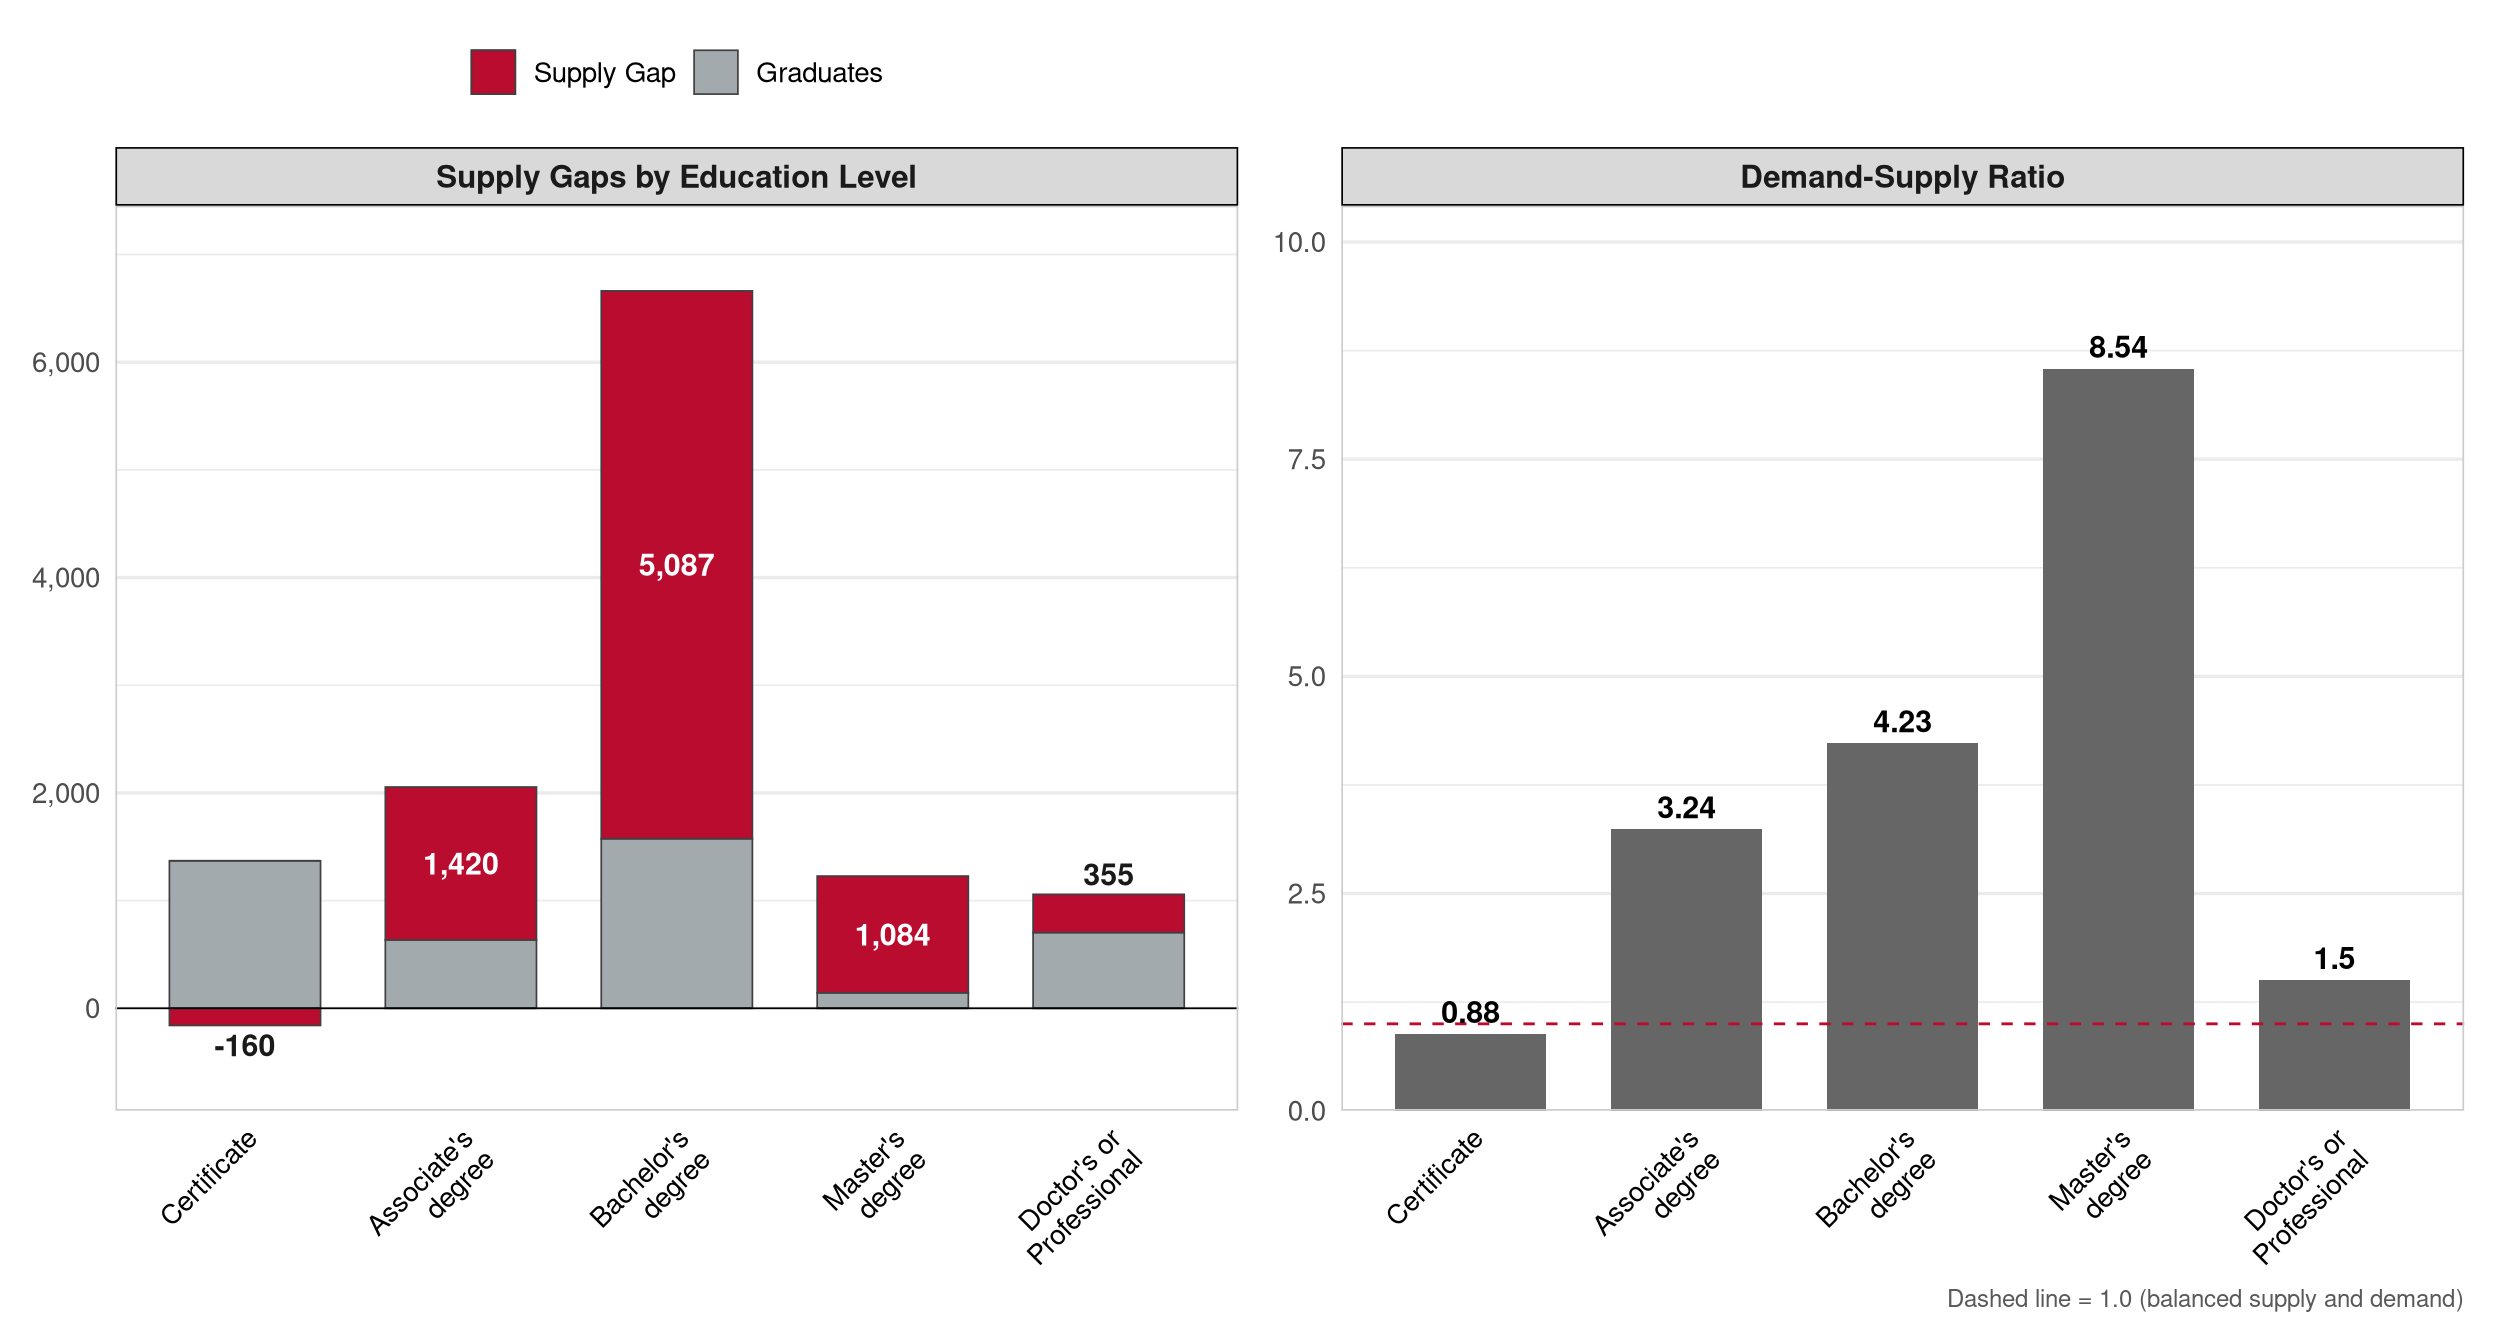
Public Service & Safety covers corrections and security, emergency services, government and public administration, law and legal services, and military and defense. Demand spans associate’s through bachelor’s and professional degree levels, reflecting the credential diversity of the occupations involved. Law and legal services Sub-Clusters exhibit some of the largest demand-supply ratios in the dataset at the doctoral/doctor’s level; these figures are best interpreted relative to the absolute gap rather than the ratio, as small graduate volumes in narrow specializations can produce extreme ratios that overstate the addressable shortage. Replacement demand is a larger driver of openings in this cluster than growth, consistent with the public sector employment patterns underlying most of its occupations.
| Metric | Value |
|---|---|
| Sub-Clusters | Emergency Response; Judicial Systems; Local, State, & Federal Services; Military & National Security; Public Safety |
| Adj. Graduates | 3,363 |
| Conversion Rate | 8.3% |
| Annual Supply Gap | 8,850 |
| Proj. Annual Growth | 512 |
| Total Employment | 288,162 |
| Total Earnings | $22.4B |
| Avg Earnings/Worker | $77,900 |
| D-S Ratio | 3.631 |
| 1 D-S ratio = annual demand ÷ adjusted graduate supply. This cluster has a conversion rate below 10%, indicating very limited higher-education pathways relative to total openings. The supply gap is the more reliable comparator. | |
| Institution | Type | Total Grads (Raw) | Stay-in-State Rate | Adj. Graduates | % of Cluster Supply |
|---|---|---|---|---|---|
| Ohio State University-Main Campus | Public 4-Year | 4,305 | 52.1% | 401 | 15.9% |
| Sinclair Community College | Public 2-Year | 1,037 | 39.7% | 323 | 12.8% |
| Clark State College | Public 2-Year | 445 | 80.6% | 310 | 12.3% |
| University of Cincinnati-Main Campus | Public 4-Year | 2,032 | 58.5% | 309 | 12.2% |
| Eastern Gateway Community College | Public 2-Year | 1,870 | 23.0% | 303 | 12.0% |
| Columbus State Community College | Public 2-Year | 306 | 72.0% | 197 | 7.8% |
| Cleveland State University | Public 4-Year | 1,081 | 70.1% | 188 | 7.5% |
| University of Akron Main Campus | Public 4-Year | 759 | 61.7% | 180 | 7.1% |
| Ohio University-Main Campus | Public 4-Year | 1,415 | 49.6% | 170 | 6.7% |
| University of Toledo | Public 4-Year | 955 | 49.6% | 143 | 5.6% |
| # | CIP Code | Program | Primary Level | Adj. Graduates1 | % of Cluster Supply | # Institutions | # SOCs Served |
|---|---|---|---|---|---|---|---|
| 1 | 43.0107 | Criminal Justice/Police Science | Associate's degree | 949 | 25.4% | 26 | 4 |
| 2 | 22.0101 | Law | Doctor's or Professional | 678 | 18.1% | 9 | 5 |
| 3 | 43.0203 | Fire Science/Fire-fighting | Associate's degree | 583 | 15.6% | 8 | 3 |
| 4 | 43.0104 | Criminal Justice/Safety Studies | Associate's degree | 548 | 14.6% | 23 | 2 |
| 5 | 14.0801 | Civil Engineering, General | Bachelor's degree | 207 | 5.5% | 12 | 1 |
| 6 | 45.0603 | Econometrics and Quantitative Economics | Bachelor's degree | 205 | 5.5% | 12 | 2 |
| 7 | 03.0103 | Environmental Studies | Associate's degree | 155 | 4.1% | 16 | 1 |
| 8 | 03.0104 | Environmental Science | Associate's degree | 149 | 4.0% | 28 | 2 |
| 9 | 22.0302 | Legal Assistant/Paralegal | Associate's degree | 139 | 3.7% | 15 | 2 |
| 10 | 44.0701 | Social Work | Associate's degree | 128 | 3.4% | 39 | 1 |
| 1 Adjusted graduates reflect stay-in-state rate × CIP-SOC crosswalk weight; summed across SOCs within cluster. | |||||||
Supply Chain & Transportation
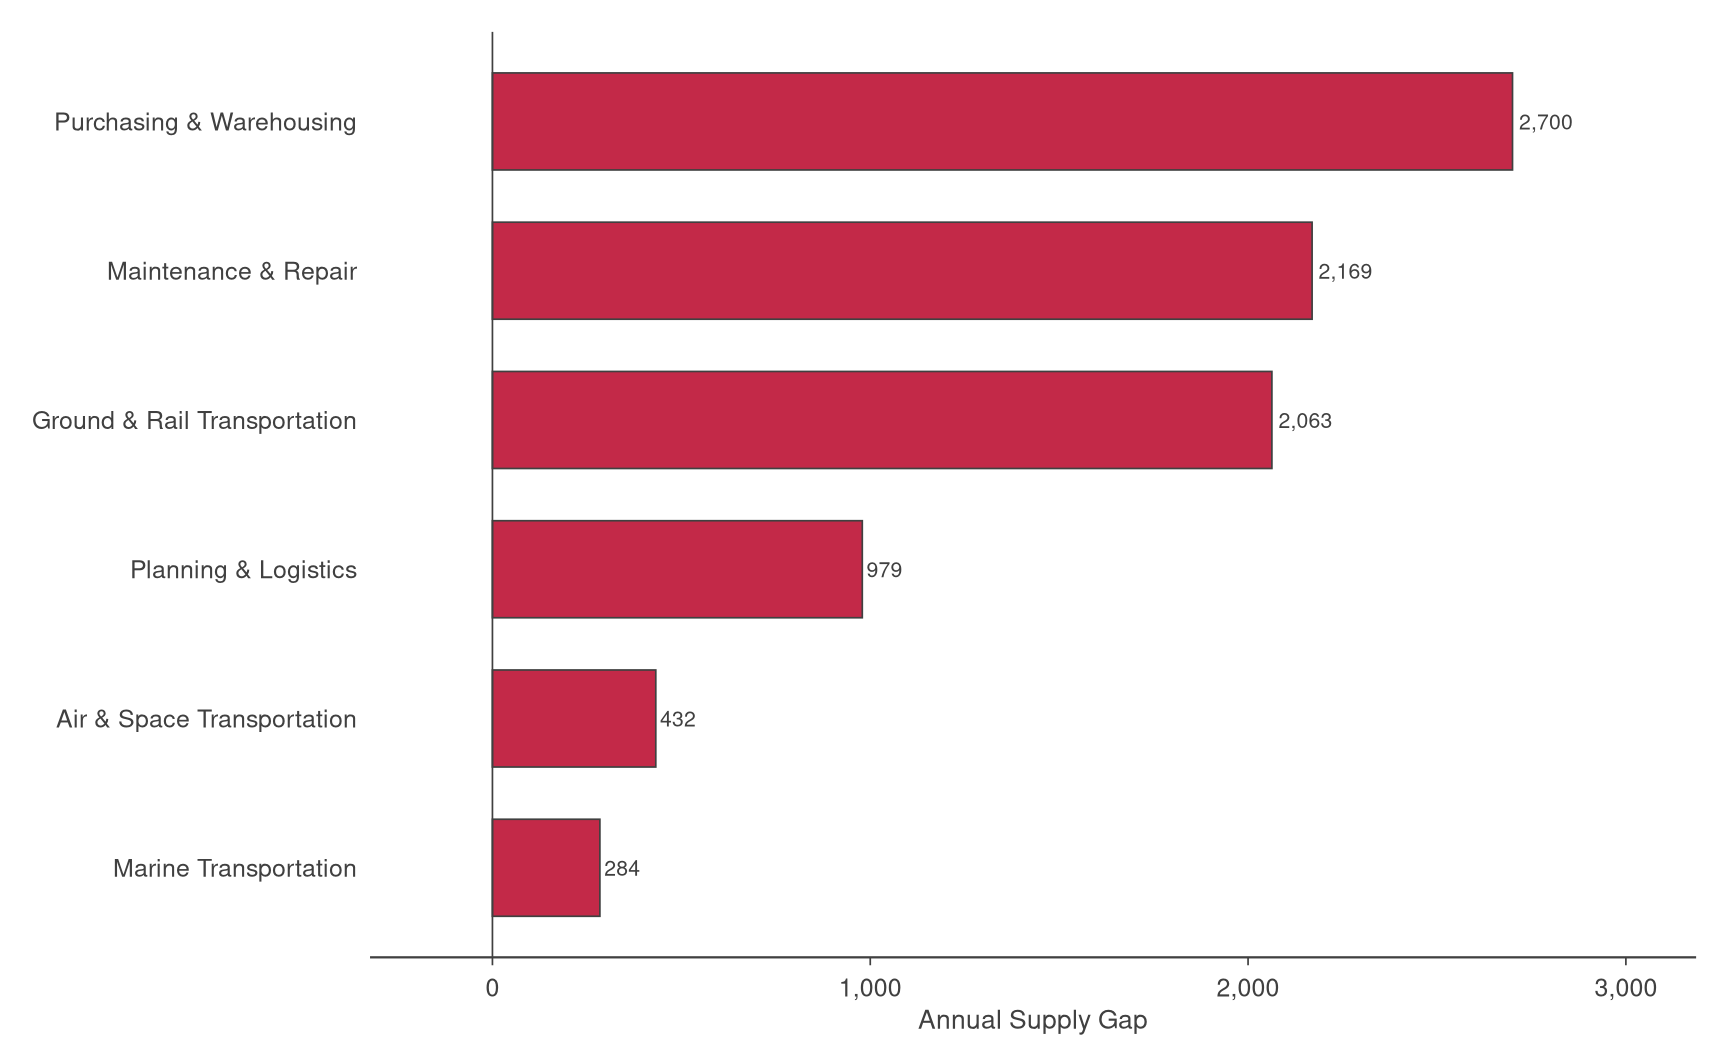
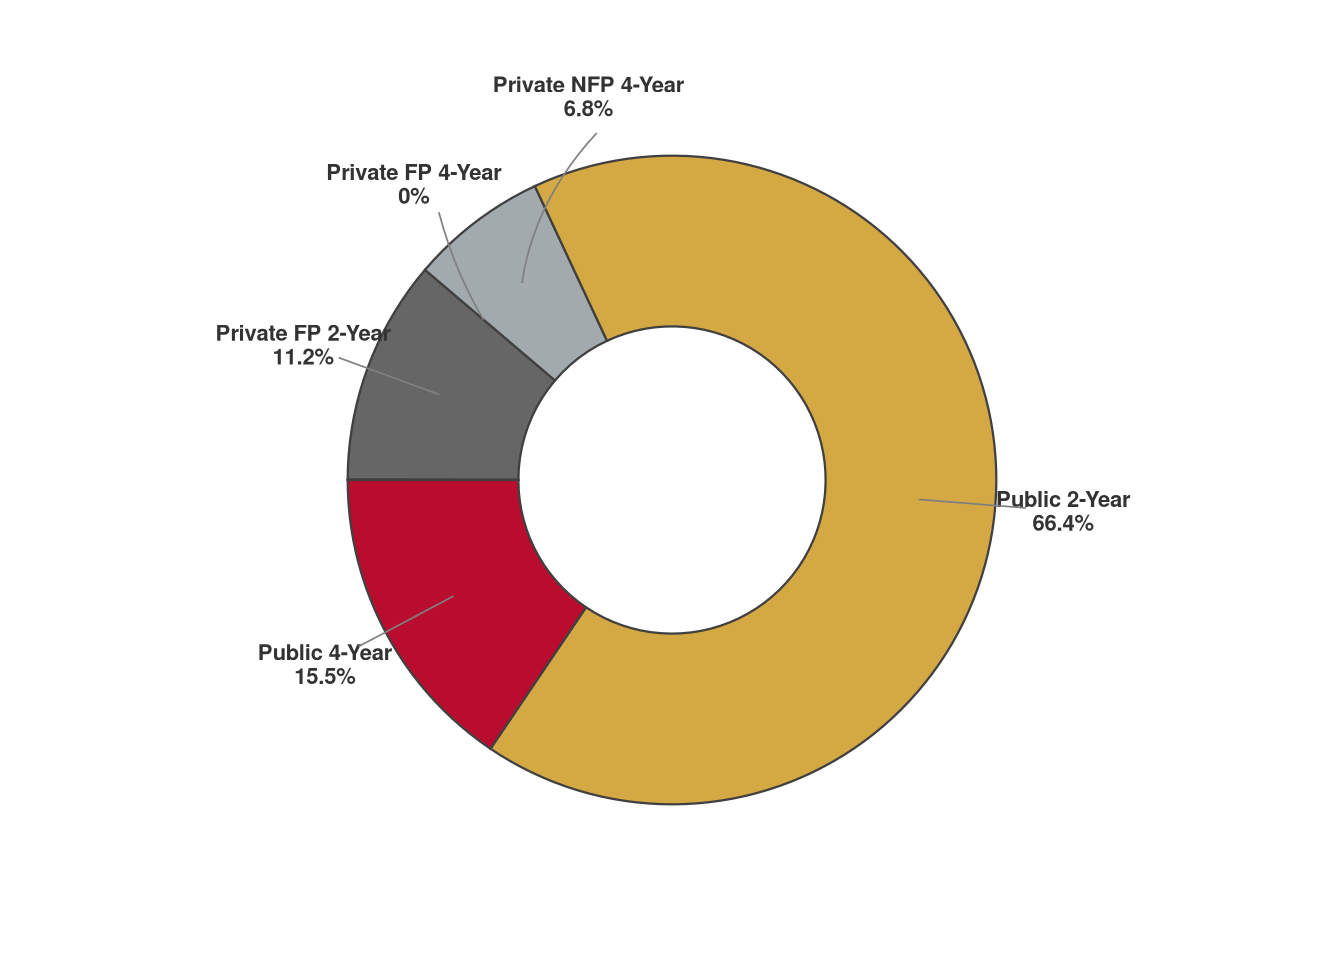
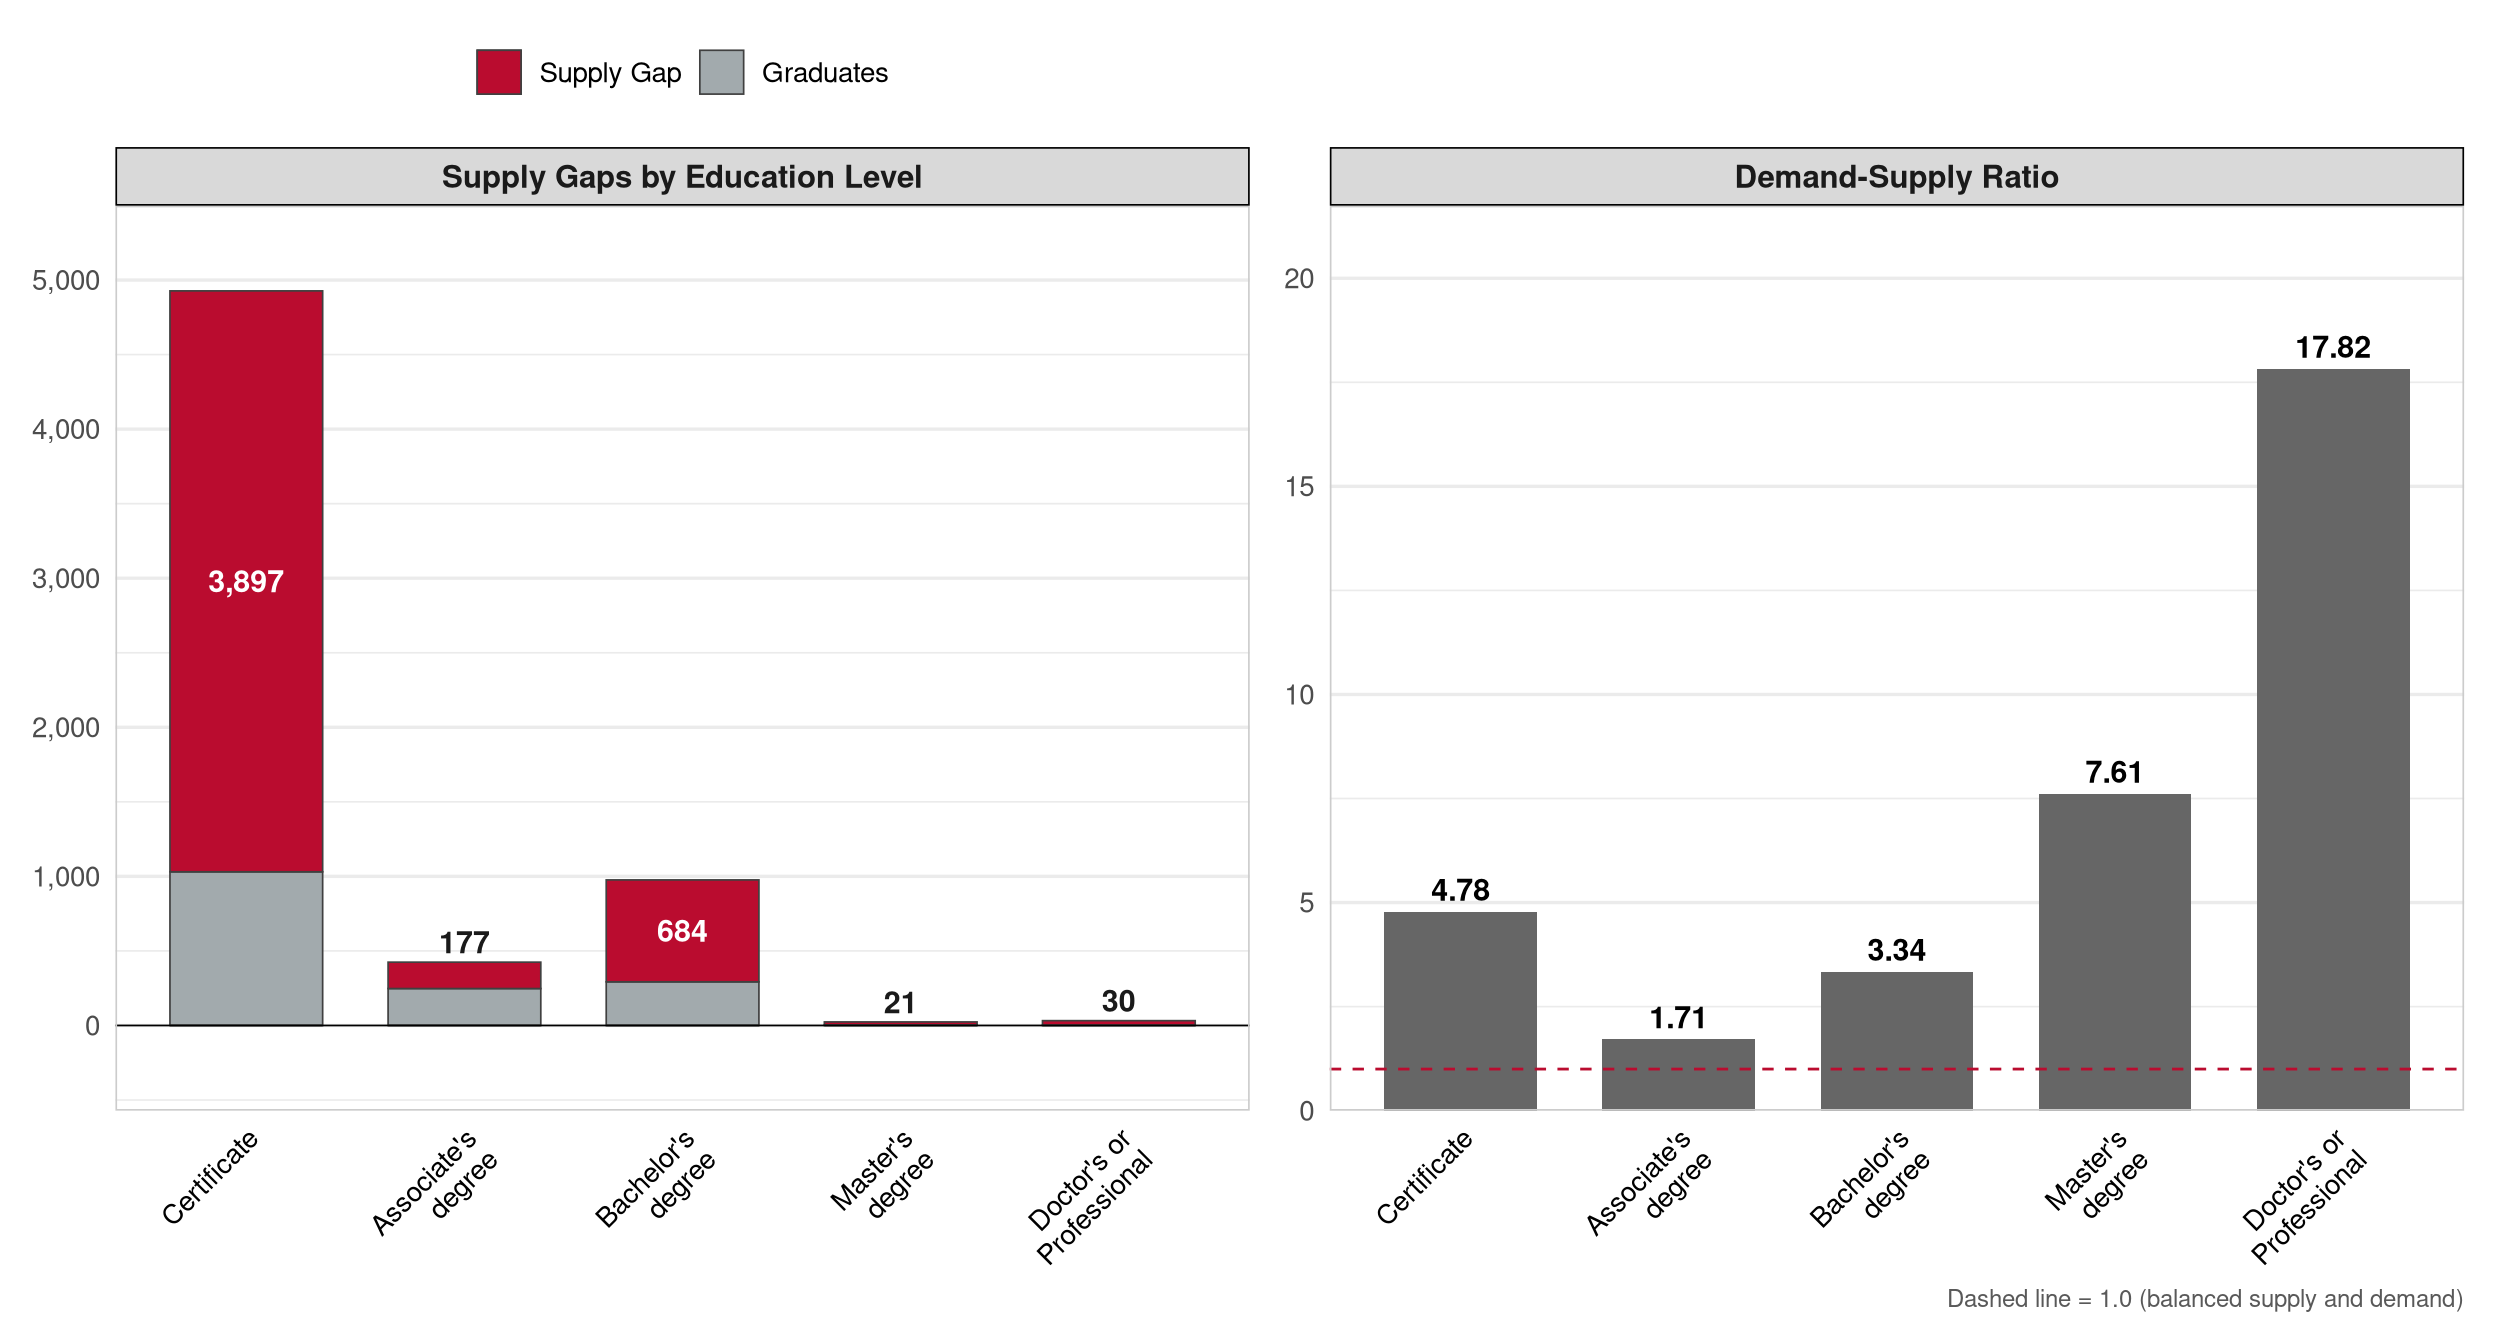
Supply Chain & Transportation includes air and space transportation, distribution and warehousing, logistics management, maritime transportation, rail transportation, and trucking and ground transportation. The cluster’s conversion rate is approximately 16%, meaning that postsecondary pathways cover a meaningful but not dominant share of the cluster’s total occupational openings. The postsecondary-relevant portion of the cluster is concentrated in logistics management and supply chain analytics, roles where program development at both the associate’s and bachelor’s levels represents the most tractable near-term opportunity for closing the credential gap. The remainder of cluster demand is filled through driver and operator pathways that fall outside the framework’s higher-education scope.
| Metric | Value |
|---|---|
| Sub-Clusters | Air & Space Transportation; Ground & Rail Transportation; Maintenance & Repair; Marine Transportation; Planning & Logistics; Purchasing & Warehousing |
| Adj. Graduates | 1,521 |
| Conversion Rate | 15.9% |
| Annual Supply Gap | 4,863 |
| Proj. Annual Growth | 243 |
| Total Employment | 282,533 |
| Total Earnings | $17.8B |
| Avg Earnings/Worker | $62,800 |
| D-S Ratio | 4.20 |
| Institution | Type | Total Grads (Raw) | Stay-in-State Rate | Adj. Graduates | % of Cluster Supply |
|---|---|---|---|---|---|
| Sinclair Community College | Public 2-Year | 1,509 | 49.3% | 405 | 31.8% |
| Stark State College | Public 2-Year | 344 | 73.9% | 235 | 18.4% |
| Ohio Technical College | Private FP 2-Year | 220 | 74.1% | 159 | 12.4% |
| Columbus State Community College | Public 2-Year | 480 | 74.3% | 114 | 9.0% |
| Cuyahoga Community College District | Public 2-Year | 166 | 73.1% | 104 | 8.2% |
| Ohio State University-Main Campus | Public 4-Year | 298 | 46.9% | 78 | 6.1% |
| Washington State Community College | Public 2-Year | 82 | 73.3% | 60 | 4.7% |
| Bowling Green State University-Main Campus | Public 4-Year | 128 | 61.8% | 46 | 3.6% |
| University of Toledo | Public 4-Year | 212 | 58.9% | 39 | 3.1% |
| University of Northwestern Ohio | Private NFP 4-Year | 158 | 60.1% | 33 | 2.6% |
| # | CIP Code | Program | Primary Level | Adj. Graduates1 | % of Cluster Supply | # Institutions | # SOCs Served |
|---|---|---|---|---|---|---|---|
| 1 | 47.0604 | Automobile/Automotive Mechanics Technology/Technician | Associate's degree | 528 | 39.8% | 8 | 3 |
| 2 | 52.0203 | Logistics, Materials, and Supply Chain Management | Associate's degree | 226 | 17.0% | 11 | 2 |
| 3 | 51.0810 | Emergency Care Attendant (EMT Ambulance) | Certificate | 139 | 10.5% | 3 | 1 |
| 4 | 15.0803 | Automotive Engineering Technology/Technician | Associate's degree | 124 | 9.4% | 5 | 2 |
| 5 | 52.0201 | Business Administration and Management, General | Bachelor's degree | 80 | 6.0% | 55 | 1 |
| 6 | 52.0205 | Operations Management and Supervision | Bachelor's degree | 63 | 4.8% | 10 | 1 |
| 7 | 49.0205 | Truck and Bus Driver/Commercial Vehicle Operator and Instructor | Certificate | 48 | 3.6% | 3 | 4 |
| 8 | 47.0613 | Medium/Heavy Vehicle and Truck Technology/Technician | Associate's degree | 42 | 3.2% | 2 | 2 |
| 9 | 47.0608 | Aircraft Powerplant Technology/Technician | Associate's degree | 40 | 3.1% | 3 | 1 |
| 10 | 47.0607 | Airframe Mechanics and Aircraft Maintenance Technology/Technician | Associate's degree | 36 | 2.7% | 3 | 1 |
| 1 Adjusted graduates reflect stay-in-state rate × CIP-SOC crosswalk weight; summed across SOCs within cluster. | |||||||