Statewide Overview
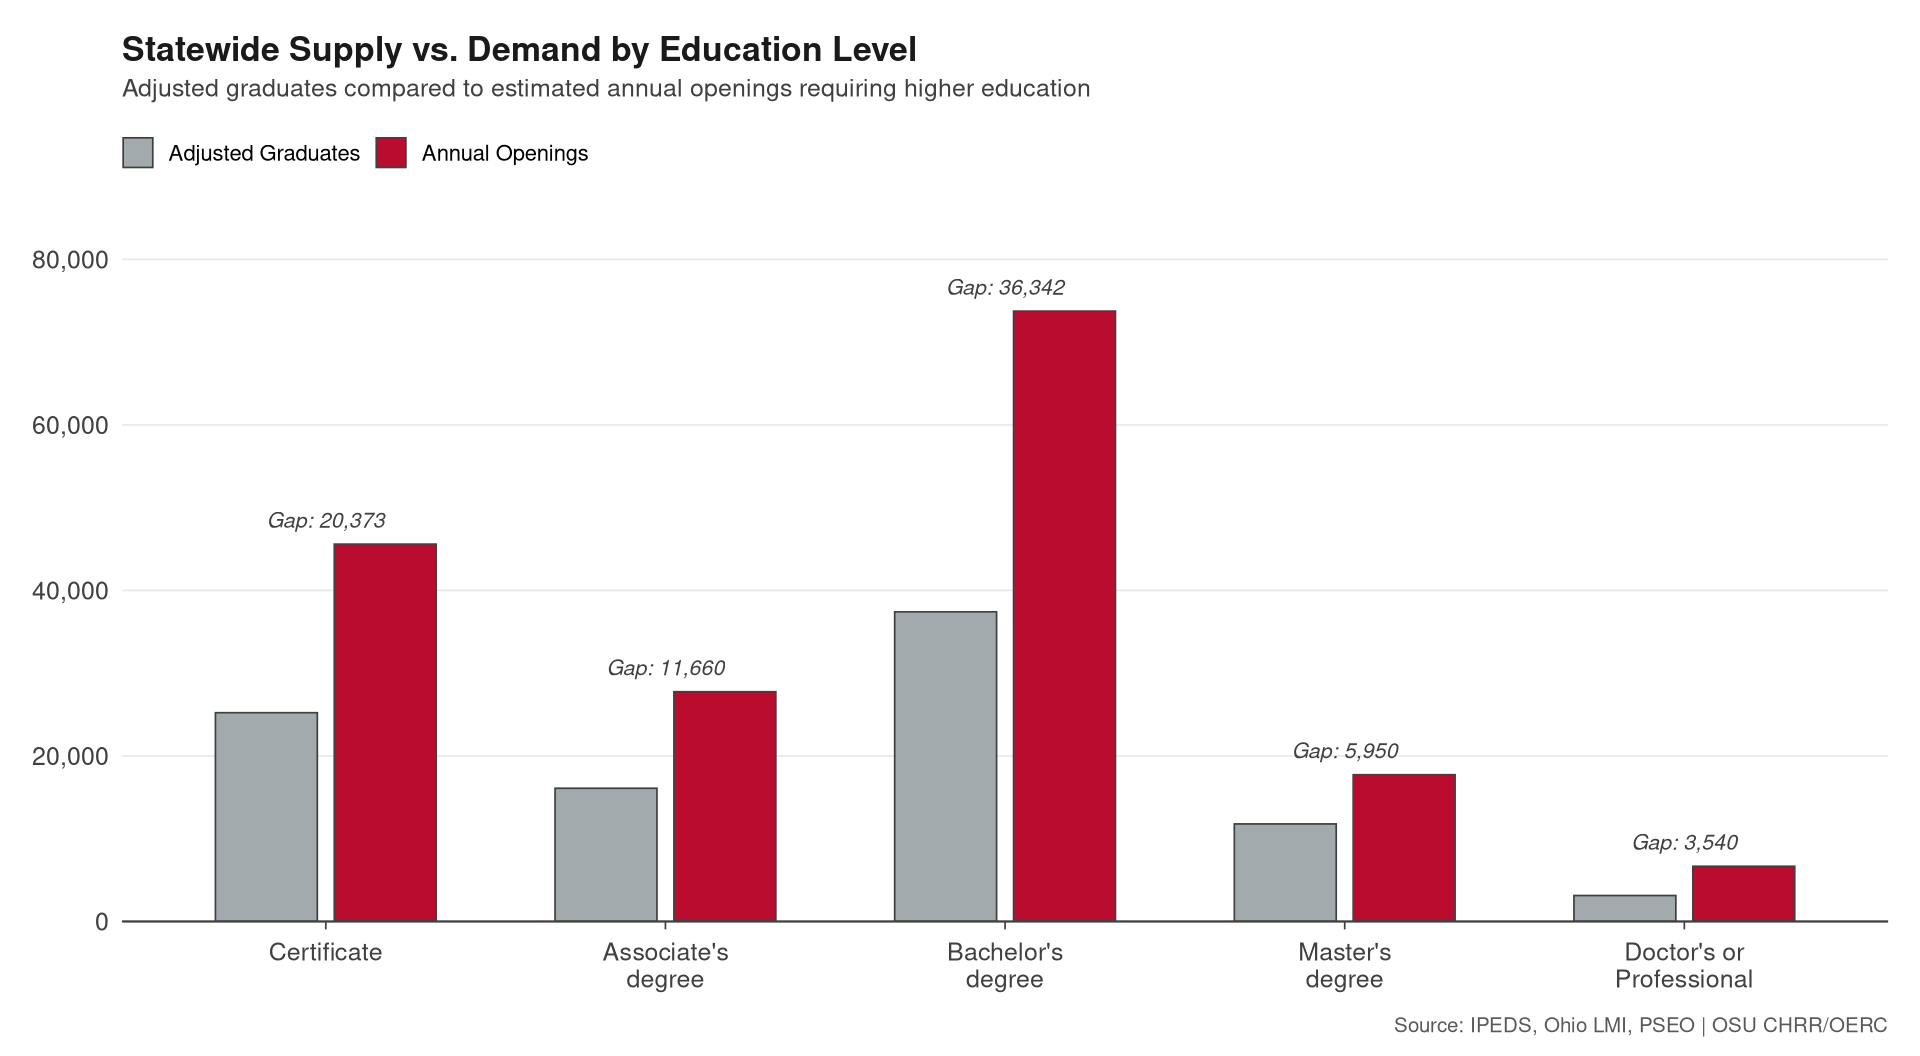
This section presents aggregate supply-demand conditions across Ohio’s postsecondary workforce preparation system. The figures reported here represent statewide totals and provide context for the cluster-level analysis presented in Section 3. Unless otherwise noted, the demand measure used throughout is the openings-based gap: the difference between annual job openings requiring postsecondary credentials (growth openings plus replacement openings) and adjusted graduate supply. Projected employment growth is reported as a complementary forward-looking metric.
Overall Supply-Demand Balance
Ohio’s higher education system produces a substantial volume of credential holders each year, yet the adjusted supply of graduates entering Ohio’s workforce falls well short of annual employer demand for postsecondary-credentialed workers. After applying stay-in-state employment rates and CIP-to-SOC distribution weights, the state produces approximately 93,648 adjusted graduates annually, that is, graduates employed in Ohio in an occupation aligned with their program of study. Given there are an estimated 171,514 annual openings requiring postsecondary credentials, the statewide openings-based supply gap is approximately 77,866 positions per year. This gap should be interpreted as a directional indicator rather than a precise fill target, both overall and within each occupation. Factors including interstate migration of graduates, occupational mobility, and evolving program-occupation alignment affect the accuracy of the overall gap. Each gap should not be interpreted as “X number of openings must be filled by Y number of new graduates or retrained workers.” The relative differences in magnitudes between these gaps, their general makeup by school and program types, and the higher-level cluster differences all provide informative narratives within the Ohio workforce landscape.
The 171,514 figure used throughout the supply-demand analysis reflects two adjustments to the raw LMI openings counts. First, the analysis is restricted to occupations paired with a postsecondary instructional program in the Advance CTE Career Clusters Framework; this scope limit is what allows gaps to be broken out by Sub-Cluster, credential level, and institution type. Second, each occupation’s raw openings are scaled by the O*NET-derived share of that occupation typically filled by postsecondary credential holders. This is done so that roles where only a fraction of workers hold credentials contribute proportionally rather than at their full count. Limiting the analysis scope to framework-mapped occupations is what allows the gap to be broken up by Sub-Cluster, credential level, and institution type. Openings outside the framework’s scope do not have an attached supply pipeline that the analysis can speak to.
Projected annual employment growth of approximately 8,029 net new positions confirms that aggregate workforce demand is expanding. While growth projections are more modest than total openings, reflecting the distinction between replacement hiring and genuine economic expansion, the directional signal is consistent: Demand for postsecondary-credentialed workers in Ohio is rising faster than current educational output can accommodate.
These statewide figures mask meaningful variation by education level and Career Cluster. Certificate- and associate-level openings represent a segment where Ohio’s two-year institutions and short-term credential programs are critical yet historically underexamined pathways. Conversely, certain doctoral/doctor’s and professional programs exhibit near-balance or marginal oversupply, reflecting the concentration of graduate program completions in a limited set of disciplines.
Career Cluster Summary
The table below presents supply-demand conditions for each of Ohio’s 14 Career Clusters, ranked by the openings-based supply gap. The gap figures reflect aggregation of Sub-Cluster-level data and include some degree of cross-Sub-Cluster overlap inherent in the underlying CIP-SOC crosswalk; they should be interpreted as relative rankings rather than additive totals. The demand-supply (D-S) ratio reflects the estimated ratio of higher-education-attributable openings to adjusted graduate supply within each cluster. Clusters with very high D-S ratios, such as Hospitality and Energy, have limited higher education pathways covering their occupations relative to total openings, making ratio-based comparisons less informative than absolute gap size for policy targeting. D-S ratio cells are grayed out for these clusters in the table below.
The top clusters by gap are Healthcare & Human Services, Management & Entrepreneurship, Construction, and Financial Services, with Marketing & Sales close behind. Together, these clusters account for the preponderance of unmet demand. Healthcare & Human Services and Digital Technology also lead in projected annual growth (2,876 and 1,633 net new positions, respectively), placing them among the clusters presenting the strongest combined case for program investment: high current gap alongside strong projected growth.
A note on interpreting the cluster table: Conversion rates at the cluster level range from approximately 5% (Hospitality, Agriculture) to roughly 22% (Healthcare & Human Services, which has the broadest postsecondary-pathway coverage among Ohio’s Career Clusters). For the higher-conversion clusters, including Healthcare & Human Services, Education, Supply Chain & Transportation, Advanced Manufacturing, and Arts, Entertainment, & Design, the conversion adjustment is most meaningful, and both the gap and the D-S ratio are informative measures of where postsecondary investment can address employer demand.
For low-conversion clusters, including Hospitality, Agriculture, Energy & Natural Resources, Financial Services, Public Service & Safety, Construction, and Marketing & Sales, the demand-supply ratio appears very high, not because postsecondary supply falls dramatically short of openings, but because postsecondary education pathways cover only a small fraction of total occupational openings in those clusters. Many of the associated jobs are filled by on-the-job training, apprenticeships, or experience-based progression rather than through higher education credentials. For these clusters, the absolute gap is the more reliable comparator, and the D-S ratio cells are grayed out in the table accordingly.

| # | Career Cluster | Adj. Graduates | Conv. Rate | Supply Gap | Proj. Growth | D-S Ratio1 | Severity |
|---|---|---|---|---|---|---|---|
| 1 | Healthcare & Human Services | 23,415 | 21.8% | 16,325 | 2,876 | 1.70 | Wide |
| 2 | Management & Entrepreneurship | 15,319 | 9.1% | 13,380 | 644 | 1.87 ‡ | Wide |
| 3 | Construction | 2,614 | 9.0% | 11,722 | 448 | 5.48 ‡ | Wide |
| 4 | Financial Services | 3,979 | 7.7% | 9,936 | 576 | 3.50 ‡ | Wide |
| 5 | Marketing & Sales | 2,357 | 9.7% | 9,407 | 320 | 4.99 ‡ | Wide |
| 6 | Public Service & Safety | 3,363 | 8.3% | 8,850 | 512 | 3.63 ‡ | Wide |
| 7 | Arts, Entertainment, & Design | 3,051 | 13.6% | 7,316 | 1,096 | 3.40 | Moderate |
| 8 | Advanced Manufacturing | 6,701 | 14.8% | 6,882 | 483 | 2.03 | Moderate |
| 9 | Energy & Natural Resources | 925 | 7.5% | 6,850 | 270 | 8.41 ‡ | Wide |
| 10 | Hospitality, Events, & Tourism | 852 | 5.0% | 6,260 | 191 | 8.34 ‡ | Wide |
| 11 | Supply Chain & Transportation | 1,521 | 15.9% | 4,863 | 243 | 4.20 | Moderate |
| 12 | Education | 21,197 | 16.3% | 3,411 | 1,026 | 1.16 | Narrow |
| 13 | Digital Technology | 7,693 | 9.0% | 3,219 | 1,633 | 1.42 ‡ | Narrow |
| 14 | Agriculture | 661 | 4.9% | 244 | 118 | 1.37 ‡ | Narrow |
| 1 D-S ratio = annual demand ÷ adjusted graduate supply. Values marked ‡ are clusters with conversion rate < 10% (limited higher-education pathways relative to total openings); supply gap is the more reliable comparator for these clusters. | |||||||
Top Sub-Cluster Gaps
Sub-cluster data reveal the specific workforce pathways driving Ohio’s aggregate shortage. Because a single career cluster may contain both critically undersupplied Sub-Clusters and others near balance, targeting at the Sub-Cluster level allows a more detailed look into smaller groupings of similar occupations. The table below identifies the Sub-Clusters with the largest annual supply gaps statewide, providing a ranked set of priorities for institutions and state planners considering where expanded program capacity would have the greatest workforce impact. It should be noted again that the relationship between Sub-Clusters and Career Clusters is not one-to-one; Sub-Clusters may appear within multiple clusters, and some occupations map to multiple Sub-Clusters.
| # | Career Cluster | Sub-Cluster | Adj. Graduates | Supply Gap | Proj. Growth | Gap + Growth | Employment | Earnings ($M) |
|---|---|---|---|---|---|---|---|---|
| 1 | Management & Entrepreneurship | Entrepreneurship & Small Business | 4,410 | 17,186 | 562 | 17,748 | 410,138 | 40,092 |
| 2 | Management & Entrepreneurship | Leadership & Operations | 10,815 | 13,149 | −634 | 12,516 | 528,544 | 43,334 |
| 3 | Construction | Skilled Trades | 1,050 | 11,031 | 384 | 11,415 | 308,533 | 18,145 |
| 4 | Healthcare & Human Services | Physical Health | 15,685 | 8,958 | 1,684 | 10,643 | 435,159 | 36,928 |
| 5 | Marketing & Sales | Retail & Customer Experience | 2,590 | 8,720 | −468 | 8,252 | 440,660 | 18,977 |
| 6 | Public Service & Safety | Local, State, & Federal Services | 615 | 8,430 | 461 | 8,891 | 171,053 | 13,450 |
| 7 | Hospitality, Events, & Tourism | Travel & Leisure | 149 | 8,041 | 55 | 8,095 | 175,038 | 6,568 |
| 8 | Financial Services | Accounting | 1,811 | 6,600 | 43 | 6,644 | 168,422 | 10,854 |
| 9 | Advanced Manufacturing | Production & Automation | 2,917 | 6,333 | 62 | 6,395 | 341,576 | 20,855 |
| 10 | Hospitality, Events, & Tourism | Culinary & Food Services | 368 | 6,253 | 76 | 6,329 | 475,019 | 16,436 |
| 11 | Management & Entrepreneurship | Business Information Management | 1,523 | 5,783 | 693 | 6,475 | 97,673 | 10,448 |
| 12 | Healthcare & Human Services | Community & Social Services | 2,209 | 5,774 | 413 | 6,187 | 103,627 | 6,053 |
| 13 | Energy & Natural Resources | Conservation & Land Management | 347 | 4,935 | 172 | 5,107 | 147,960 | 17,058 |
| 14 | Healthcare & Human Services | Personal Care Services | 1,947 | 4,719 | 184 | 4,904 | 99,785 | 4,180 |
| 15 | Arts, Entertainment, & Design | Design & Digital Arts | 1,024 | 4,654 | 1,015 | 5,669 | 82,427 | 8,779 |
Institution Type Analysis
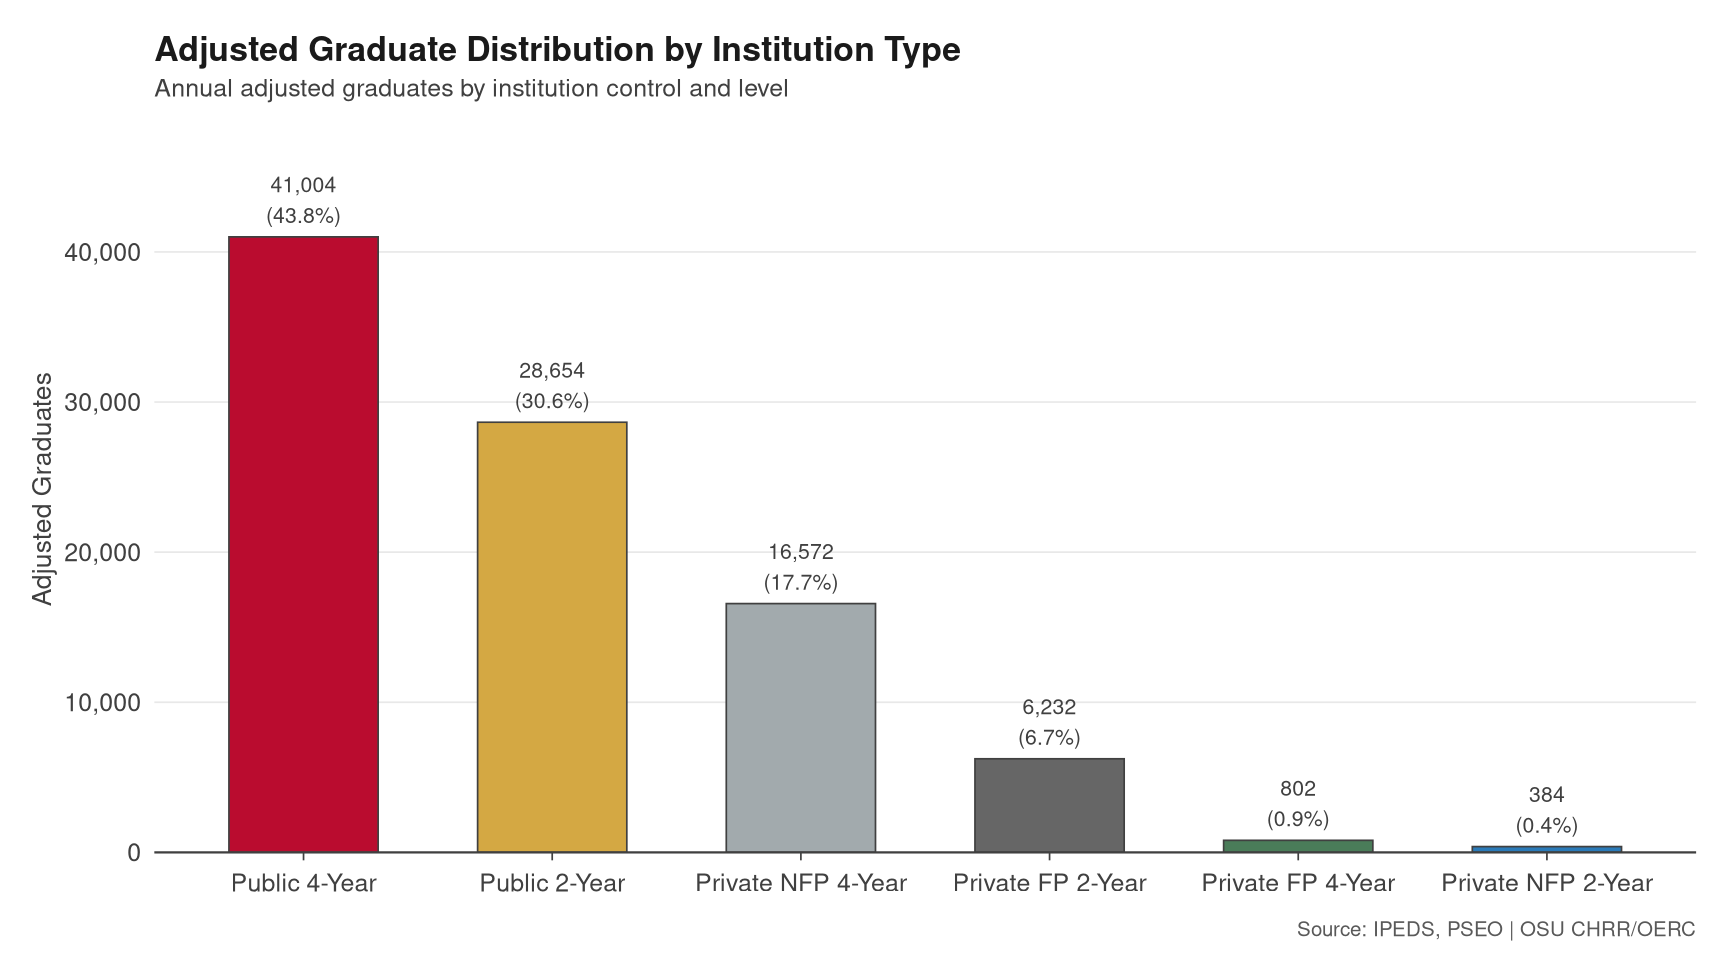
Ohio’s adjusted graduate supply is distributed across six institution types, preserving the public, private not-for-profit, and private for-profit control distinctions, separated into four-year versus two-year programs. Public four-year institutions supply the largest share at 43.8% of adjusted graduates, though with the second-lowest stay-in-state rate among the six types at 50.9%. Public two-year institutions contribute 30.6% of adjusted supply with the highest stay-in-state rate at 61.2%, indicating that Ohio’s community colleges retain graduates within the state at meaningfully higher rates than four-year institutions. Together, public institutions account for 74.4% of statewide supply.
The remaining quarter of supply is concentrated in two distinct private segments. Private not-for-profit (NFP) four-year institutions contribute 17.7% of adjusted supply, with a 53.8% stay-in-state rate, representing nearly all of Ohio’s private four-year output. Private for-profit (FP) two-year institutions contribute 6.7% of adjusted supply, with a 54.4% stay-in-state rate, representing nearly all of Ohio’s private two-year output. Two smaller segments round out the breakdown: private for-profit four-year institutions (0.9%, with a 59.8% stay-in-state rate) and private not-for-profit two-year institutions (0.4%, with a 54.1% stay-in-state rate). The clearest structural pattern is that for-profit institutions in Ohio operate predominantly at the two-year credential level, while not-for-profit private institutions operate predominantly at the four-year level. This distribution carries direct implications regarding which institution types are most responsive to regional workforce shortfalls, particularly in clusters where sub-baccalaureate pathways dominate.
| Institution Type | Total Graduates (Raw) | Avg. Stay-in-State Rate | Adjusted Graduates | % of Adj. Supply |
|---|---|---|---|---|
| Public 4-Year | 77,307 | 54.5% | 41,004 | 43.8% |
| Public 2-Year | 55,477 | 48.3% | 28,654 | 30.6% |
| Private NFP 4-Year | 30,750 | 55.2% | 16,572 | 17.7% |
| Private FP 2-Year | 11,218 | 56.5% | 6,232 | 6.7% |
| Private FP 4-Year | 1,273 | 61.2% | 802 | 0.9% |
| Private NFP 2-Year | 586 | 64.0% | 384 | 0.4% |
| TOTAL | 176,611 | — | 93,648 | 100.0% |
Wage Analysis
Wage levels provide a critical overlay on supply-demand analysis. A large gap in a high-wage cluster represents a greater economic cost than an equivalent gap in a lower-wage sector, both for individual workers in terms of foregone earnings and for Ohio’s economy in terms of talent-driven productivity and tax revenue. Clusters combining an above-average supply gap with above-average earnings per worker are the strongest candidates for targeted program investment.
Statewide, the Management & Entrepreneurship cluster generates the largest total earnings footprint (estimated at $57.1B annually across occupied positions), reflecting both its breadth and its wage levels. Healthcare & Human Services ($50.9B), Advanced Manufacturing ($26.3B), and Energy & Natural Resources ($25.6B) round out the top four by total sectoral earnings. Note that these earnings figures are deduplicated at the Career Cluster × SOC level and are not additive to a statewide total, as occupations appear in multiple clusters. All four clusters also carry significant supply gaps, reinforcing their status as high-priority targets for workforce development investment. Digital Technology stands out as a high-wage cluster with a gap of 3,219, the second-fastest projected growth (1,633 net new positions), and the highest average earnings per worker among all 14 clusters at approximately $102,500. This makes it a potential strategic focus for STEM program expansion at both the four-year and two-year levels.
The Arts, Entertainment, & Design cluster exhibits a meaningful gap of 7,316 but relatively modest total earnings ($13B) compared to other clusters. Policy targeting in this space should consider the transferability of creative and digital skills across sectors, the non-wage dimensions of arts careers, and the degree to which Design & Digital Arts Sub-Cluster graduates serve adjacent technology industries.

