Ohio Workforce Supply-Demand Gap Analysis
Aligning Higher Education with Workforce Needs
Purpose and Scope
This report examines the alignment between Ohio’s postsecondary education system and employer workforce demand. The analysis focuses on occupations that typically require a postsecondary credential (certificate through doctoral or professional degree) and on the institutions and programs that produce graduates for those occupations. Current gaps between graduate supply and job openings are assessed alongside forward-looking estimates based on projected labor market conditions. The goal is to provide evidence that supports program investment decisions for leaders at the Ohio Department of Higher Education, postsecondary institutions, and workforce development organizations across the state. The central finding is straightforward: Ohio produces fewer postsecondary-credentialed workers than its economy demands, and the shortfall is concentrated in clusters and credential levels where targeted action can have the greatest impact. Healthcare & Human Services, Management & Entrepreneurship, Construction, Financial Services, Marketing & Sales, and Public Service & Safety account for most of the statewide unmet demand, with gaps at the bachelor’s degree and sub-baccalaureate levels driving much of the shortfall.
Approach
The analysis is organized around the National Career Clusters Framework from Advance CTE (rev. 2024), which groups educational programs and occupations into 14 Career Clusters and 77 Sub-Clusters organized by sector and industry. Each sub-cluster pairs specific instructional programs (identified by Classification of Instructional Programs, or CIP, codes) with specific occupations (identified by Standard Occupational Classification, or SOC, codes). These pairings allow the analysis to connect what Ohio’s institutions produce to what Ohio’s employers need. Sub-clusters are the primary analytical unit throughout this report; career clusters serve as the organizing framework for presenting results. Because some occupations and instructional programs appear in more than one sub-cluster, summing cluster-level figures overstates the true statewide total.
Three adjustments refine the supply-demand calculations beyond raw graduation counts and job openings.
First, graduate counts are adjusted using Post-Secondary Employment Outcomes (PSEO) Flows data from the U.S. Census Bureau. This data provides one-year employed-in-state rates by institution, broad field of study, and degree level. This adjustment allows our supply estimates to reflect only the share of graduates who remain in Ohio for employment within one year of graduation.
Second, Advance CTE framework’s CIP-SOC pairings define which education programs connect to which occupations. We weight these connections based on current occupational employment numbers from Ohio LMI to account for the fact that a given degree program does not feed equally into every occupation it could serve. For example, for a hypothetical CIP that maps to three SOCs with current total employment of 20k, 30k, and 50k, respectively, the weights become 0.20, 0.30, and 0.50. A program producing 100 graduates would contribute 20, 30, and 50 graduates toward those three occupations.
Third, since the same occupation code may refer to multiple jobs requiring a range of degree levels, we allocate employment per occupation into degree levels using O*NET Education, Training, and Experience data. If, for example, a given occupation code represents jobs estimated by the O*NET data to have 50% requiring a bachelor’s degree, 30% requiring a master’s degree, and 20% requiring a doctoral or professional degree, then for 100 new openings under that occupation code we estimate that 50 of those openings would require a bachelor’s degree, 30 a master’s, and 20 doctoral or professional.
The IPEDS completions data feeding supply represents a three-year average of degrees and certificates awarded in academic years ending 2022, 2023, and 2024, smoothing year-to-year noise in completions while reflecting Ohio’s current educational output. The statewide average rate of those completers found substantively employed in Ohio one year after graduation is 53.4%, per reported programs in Census PSEO Flows. This rate is calculated over all completers, including those with no or marginal earnings in the first year (for example, graduates continuing their education). The employed-only rate of those in Ohio one year after graduation, not including those continuing to further education or with no or marginal earnings is closer to 70%. This does not account for the later inflow of credentialed workers from other states into Ohio’s labor market, which would partially offset the gap.
On the demand side, the report uses two complementary employment measures. The openings-based gap compares total annual job openings (growth openings plus replacement openings from retirements and occupational transfers) against adjusted graduate supply, capturing the current annual production shortfall. Projected employment growth reports net new job creation over the projection period, indicating where Ohio’s economy is heading independent of replacement hiring. Together, these two measures distinguish between occupation areas where demand is large because of high turnover and areas where demand is large because the sector is expanding.
Key Findings
Ohio’s postsecondary system produces approximately 93,648 adjusted graduates annually : of roughly 176,600 average annual completions, these are the graduates estimated to be substantively employed in Ohio one year after completion, distributed across the occupations aligned with their programs (see Key Terms, Section 1.4.1). There are an estimated 171,514 annual job openings requiring postsecondary credentials. The statewide supply gap totals approximately 77,866 positions per year, yielding a statewide demand-supply ratio of 1.83. For every graduate entering aligned employment in Ohio, the economy generates about two estimated openings that require a postsecondary credential. Projected annual employment growth of approximately 8,029 net new positions suggests that this demand pressure is not solely a function of replacement hiring; Ohio’s workforce needs are expanding. This gap is a directional indicator of structural misalignment, not a precise headcount to be filled. Factors including occupational mobility, credential substitution, employer training, hiring outside the expected sub-cluster, and interstate labor flows all affect real-world labor market clearing in ways the analysis does not perfectly capture. The relative differences in gap magnitude across clusters and credential levels nonetheless provide an informative basis for identifying where Ohio’s postsecondary investments can have the greatest workforce impact.
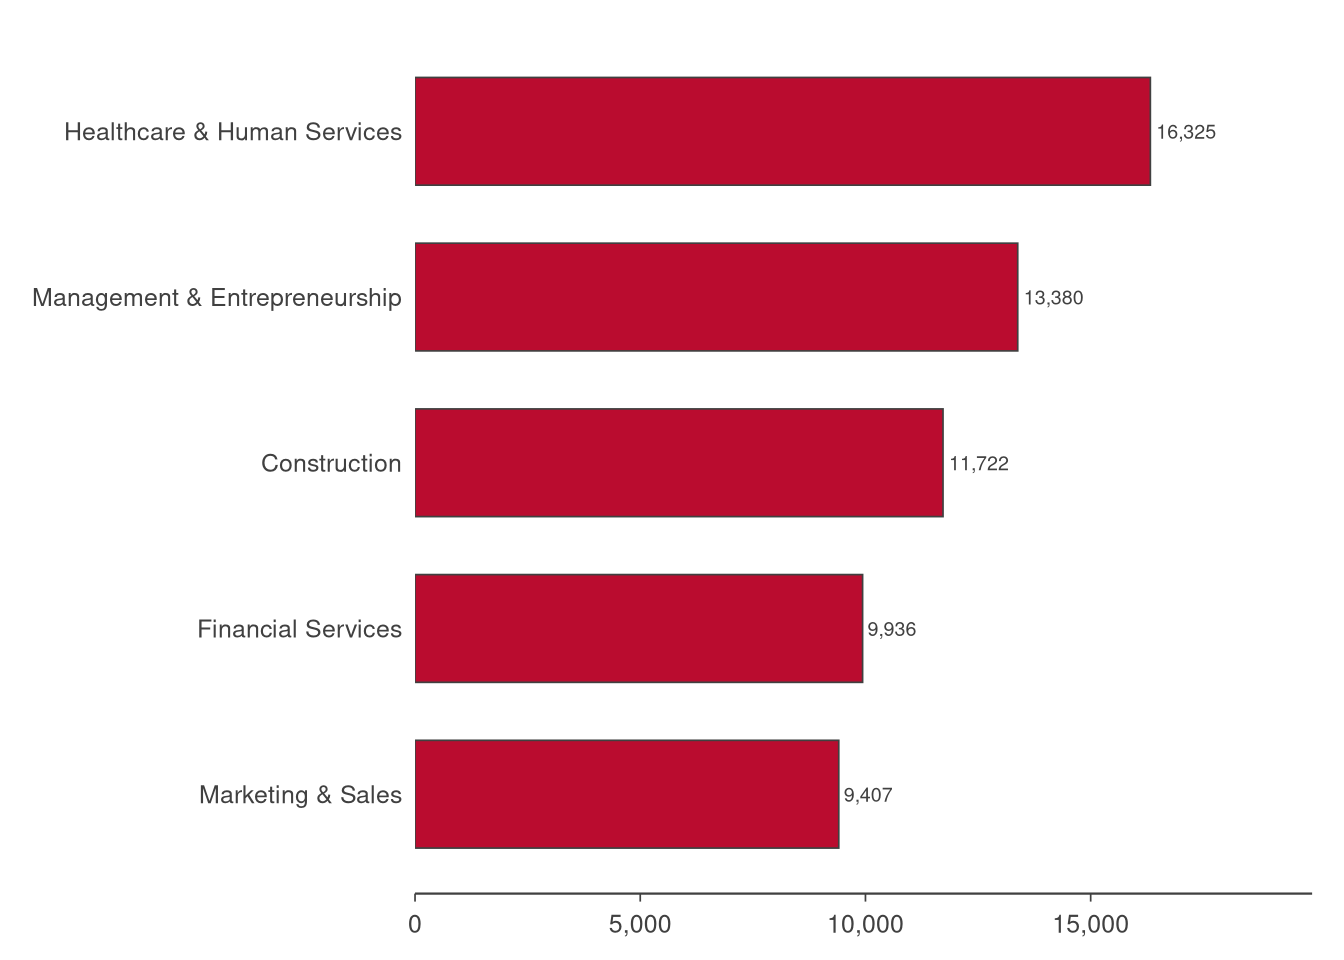
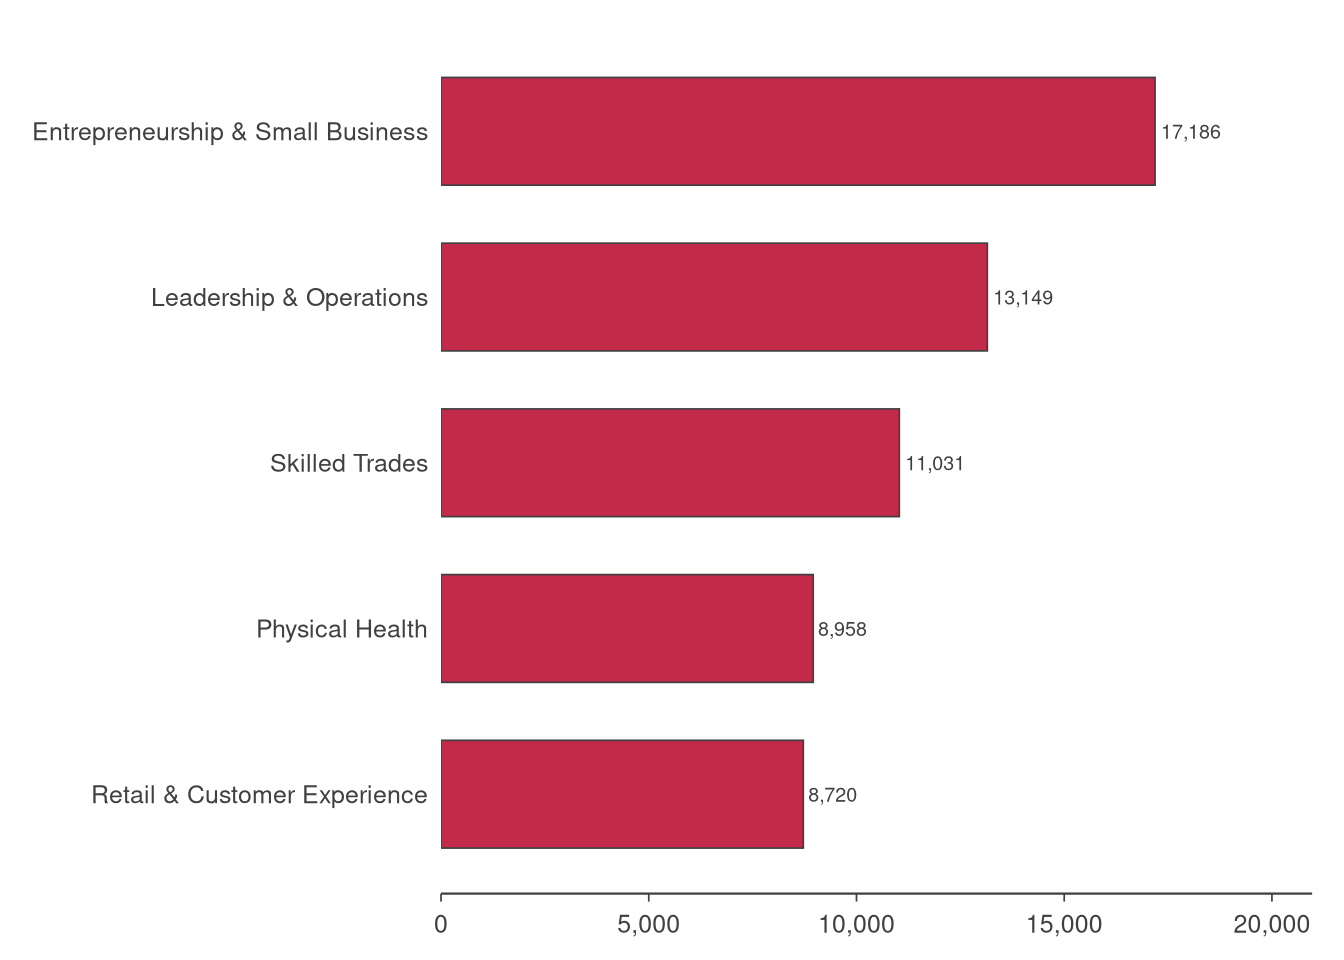
The five career clusters with the widest supply gaps account for most of the statewide unmet demand. Healthcare & Human Services needs 16,325 positions annually, combining a large current shortfall with the fastest projected employment growth of any cluster (2,876 net new positions per year). Gaps in Healthcare and Human Services are driven by nursing, allied health, and behavioral health roles where postsecondary credentials are the dominant entry pathway. Management & Entrepreneurship has a gap of 13,380, driven by broad-based demand for business operations, leadership, and entrepreneurship-related occupations across the state. Construction (11,722), Financial Services (9,936), and Marketing & Sales (9,407) round out the top five. The five largest sub-cluster gaps are Entrepreneurship & Small Business, Leadership & Operations, Skilled Trades, Physical Health, and Retail & Customer Experience. The first two belong to Management & Entrepreneurship, which explains much of that cluster’s outsized total; Skilled Trades falls under Construction, Physical Health belongs to Healthcare & Human Services, and Retail & Customer Experience spans Marketing & Sales.
All 14 career clusters carry a severity rating (Wide, Moderate, or Narrow) derived from a combined z-score of gap size and demand-supply ratio, following the methodology used in the South Carolina workforce supply-demand gap analysis.1 Eight clusters receive a Wide rating: Healthcare & Human Services, Management & Entrepreneurship, Construction, Financial Services, Marketing & Sales, Public Service & Safety, Energy & Natural Resources, and Hospitality, Events, & Tourism. These eight represent the core of Ohio’s postsecondary workforce challenge and likely merit the most attention in program planning. Three clusters receive Moderate ratings: Arts, Entertainment, & Design, Advanced Manufacturing, and Supply Chain & Transportation. The remaining three (Education, Digital Technology, and Agriculture) rate as Narrow, though this designation reflects relative position, not absence of need. Digital Technology, for instance, carries a gap of 3,219 positions and the second-highest projected employment growth among all clusters (1,633 net new positions annually), but its demand-supply ratio of 1.42 is comparatively moderate because Ohio’s institutions produce a substantial volume of computing and IT graduates.
An important interpretive note applies to clusters with low conversion rates (the share of occupational openings typically filled by postsecondary credential holders). Nine clusters have conversion rates below 10%: Agriculture (4.9%), Hospitality, Events, & Tourism (5.0%), Energy & Natural Resources (7.5%), Financial Services (7.7%), Public Service & Safety (8.3%), Construction (9.0%), Digital Technology (9.0%), Management & Entrepreneurship (9.1%), and Marketing & Sales (9.7%). In these clusters, postsecondary education pathways cover only a small fraction of total occupational openings; many of the associated jobs are filled by on-the-job training, apprenticeships, or non-credentialed pathways. Their demand-supply ratios are correspondingly large but reflect limited higher-education coverage rather than an exclusively postsecondary workforce problem, and the cells for those clusters are greyed in the cluster ranking table accordingly. For these clusters, the absolute supply gap is the more reliable comparator for policy targeting; conversion rate should be weighed alongside gap size when evaluating where postsecondary program expansion is most likely to address genuine employer demand for credentialed workers.
The findings examined in the sections that follow build on this baseline. The Statewide Overview (Section 2) provides the aggregate context, including breakdowns by education level, institution type, and wage profile. The Career Cluster Analysis (Section 3) presents a standardized profile for each of the 14 clusters. The Cross-Cluster Analysis (Section 4) compares clusters against one another on gap size, educational composition, earnings, and institutional reliance. The Summary of Findings (Section 5) closes the analytical narrative; the Methodology section (Section 6) documents the calculations underlying these results. The data, framework, and analytical approach developed here are designed to support an ongoing, recurring assessment that can be refined as new data become available and as Ohio’s workforce landscape evolves.
How to Read This Report
This report serves three primary audiences.
State agency staff could begin with this Executive Summary, then turn to the Career Cluster severity ranking and the aggregate breakdowns in the Statewide Overview (Section 2). The Cross-Cluster Analysis (Section 4) is particularly useful for identifying structural patterns that cut across individual clusters.
Institutional leaders (including provosts, academic deans, and enrollment managers) will find the most actionable detail in the Career Cluster Analysis (Section 3), which provides cluster-level supply gaps broken out by sub-cluster, degree level, and institution type. Each cluster profile identifies top producing institutions, providing benchmarks for program scale and competitive positioning. Institutions can use these profiles to assess where their current program mix aligns with, or diverges from, areas of strongest workforce need.
Workforce development practitioners and regional planners should focus on the occupation-level gap tables and sub-cluster summaries within the Statewide Overview (Section 2). These data support regional sector strategies, employer engagement planning, and career pathway design by identifying the specific roles driving unmet demand within each cluster.
Key Terms
Supply Gap: The difference between adjusted postsecondary graduates qualified for an occupation and the new annual demand within that occupation. A positive gap indicates unmet employer need.
Demand-Supply (D-S) Ratio: New annual demand divided by adjusted graduates. A ratio greater than 1.0 indicates supply shortage; a ratio less than 1.0 indicates potential oversupply. Ratios for clusters with a conversion rate below 10% should be interpreted with caution.
New Annual Demand: Newly created positions plus openings from retirements and occupational transfers. This measure does not include turnover or unfilled positions carried forward from prior years.
Adjusted Graduates: Total graduates multiplied by the employed-in-state rate, then distributed to occupations via CIP-to-SOC crosswalk weighting. This figure represents graduates meaningfully employed in Ohio in an occupation aligned with their program of study.
Employed-in-State Rate: The share of Ohio graduates found substantively employed in Ohio one year after graduation, computed as a percentage of graduates whose post-graduation employment status (in-state, out-of-state, or otherwise documented) is known to the Census PSEO Flows program. Rates for private institutions are estimated from comparable public institution groupings, as direct PSEO Flows data are currently available only for public Ohio institutions.
Occupation Rate: The proportion that graduates from a given CIP code are estimated to participate in the supply for a particular SOC code, based on current employment patterns.
Conversion Rate: The effective ratio of adjusted graduates to total graduates, reflecting both the employed in state rate and occupation rate. Clusters with very low conversion rates have few higher-education-aligned occupations relative to total openings; the absolute supply gap is a more reliable policy indicator for these clusters than the D-S ratio.
Limitations
This analysis covers only occupations that typically require a postsecondary credential. Occupations primarily filled through experience, apprenticeship, or informal training, including many roles in construction, hospitality, and agriculture, are outside the scope of the supply-demand framework used here. Some graduates work in occupations outside the typical pathway for their program, and the Advance CTE framework does not capture these transitions. PSEO employed in state rates are derived from an earlier graduating cohort than the IPEDS supply data used here, so post-pandemic shifts in retention patterns may not be fully captured in the adjusted graduate counts. The analysis also does not account for in-migration: credentialed workers relocating to Ohio from other states contribute to labor supply but do not appear in the adjusted graduate counts, which means apparent gaps in high-growth fields may be partially offset by inflow not measured here. Readers should treat gap estimates as directional indicators of relative need, not as precise fill targets.
Footnotes
Each cluster’s severity rating is derived from the average of two standardized scores: its annual supply gap and its demand-supply ratio. The demand-supply ratio is winsorized at the 90th percentile before standardization to prevent clusters with very low postsecondary conversion rates from distorting the distribution. Clusters with an average z-score above zero receive a Wide rating; between −0.5 and zero, Moderate; below −0.5, Narrow.↩︎